Matthew Peterson
Hi! I am an aspiring community ecologist researching soil microbial communities in many different environments. I often have had to troubleshoot rstudio issues by myself (yes I am self-taught). While I am no expert, I feel that I am proficient enough to help the average user troubleshoot common issues I have encountered and have gone down an endless rabbit hole of frustration to figure out. We will see how this channel grows!

Violin Plot with ggplot2

Tufte Plot in ggplot2

Box and whisker with dot plot in ggplot2

Density Plot with ggplot2

Categorical Histogram

Binned Histogram

Dumbbell Chart
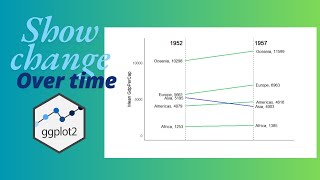
Make a Slope Chart today!

Add more plots to your tool belt!

Diversify your plot portfolio

Plot economic data!

Robust plots communicate more!

Be more descriptive with your plots

Diverging Bar Plot in R

Correlogram in R

Show data in plot margins!

Animated Plot (make a .gif in R!)

Ggplot2 Bubble Chart with regression!

Ggplot count plot

Ggplot jitter function

Ggplot scatter plot with encircled data

Ggplot correlation scatter plot

Streamline your calculations in R

Put a spin on your bar charts!

Flip your boxplot (ggplot tutorial in rstudio)

Stacked Bar Charts and using Jitter in Scatterplots within ggplot2

Introducing Geoms (ggplot2 tutorial)

Faceting your data in ggplot

Ggplot2 scatter plot introduction

Quit wasting your time! Improve your ggplots fast!