Statistics with Nabi
Welcome to Statistics with Nabi, the ultimate YouTube channel dedicated to helping students studying statistics at the intermediate and BS levels. By subscribing, you’ll save on coaching expenses while strengthening your understanding of key statistical concepts. This channel provides comprehensive lessons on R Studio, SPSS, Excel, and more, with a focus on practical learning. Additionally, we offer valuable data science courses through R and Python to enhance your skills. Whether you're a student, researcher, or data enthusiast, Statistics with Nabi is here to help you master the world of statistics. Don’t forget to subscribe for the latest updates!
For any queries or support, feel free to contact us on WhatsApp: +923189634889.

R program that convert years into days

How to Create a Scatter Plot in R Using ggplot2: A Step-by-Step Guide

How to Create Grouped Histograms in R Using ggplot2 (Step-by-Step Guide)

Simple Linear Regression Model
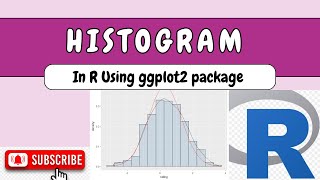
Histogram in R using ggplot2 package

Box plot in R by using ggplot2

Introduction to ggplot2 package

Exponential Distribution in R

Normal Distribution in R

Robust Regression in R

Detection of outliers in R

Pie chart in R (Plotly Package)

Funnel chart in R

Handling Missing Values in R

Correlation in R

Muti Layers Pie Donut Chart Using R

Application of statistics in the world of data science

How to Create Two Way table in R

Cochran Test in R

Shapiro Wilks normality test in R

Primary vs Secondary Data

What is statistics?

How to Import SPSS File in R

Convert DataFrame in Excel File Using R

Correlation Matrix in R

Variance Inflation Factor in R

Leven's Test in R

Tukey HSD Test using R

Kruskal Wallis Test using R

Bartlett Test using R studio.