Unit of Technical Analysis for trading
Technical Analysis for Stock Market trading Channel.
Studied the past 4 Bull/ Bear Cycles, and identified pattens in the Stock Market.
A typical pattern which occurs over and over again and again during Uptrend as well as Downtrend is called as Unit of Technical Analysis.
These Patterns occur over, multiple time frames and we can trade them to make profits.
Playlist in the Channel:
1. Unit of Technical Analysis 1- 10 gives us
Bull/ Bear Cycle patterns and then similar patterns when a Bear/ Bull cycle occurs, we have identified them with the help of Fibonacci
2. WD Gann Trading Techniques: We have seen Gann Emblem and we can trade the Gann Emblem for 90- 120 days cycles, we can seen one such cycle which was traded with 10X returns, all we learned Squaring of Time and Price in 2 methods
3. Intraday Trading in Nifty and Stocks: trades executed are explained with the logic and time frame selected.
4. Nifty weekly predictions using Chart Patterns, Fibonacci, Indicators, Candlesticks

Business of Future: Part I Introduction

Бесплатный вебинар WD Gsnn 2 октября 2025 г.

English WD Gann Master Commodities Course: Time Price Square
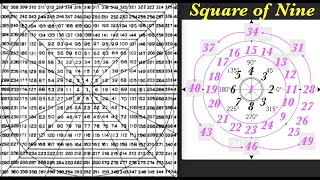
English WD Gann Master Commodities Course: Geometry: Time By Degree: Wheel of 8 Square of 9- Part II

English WD Gann Master Commodities Course: Geometry: Time By Degree: Wheel of Eight Square of Nine

Multi-bagger Swing Positional

English WD Gann Master Commodities Course: Geometry: Time By Degree

English WD Gann Master Commodities Course: Geometry: Gann Angles Time Price Square

English WD Gann Master Commodities Course: Summer Solstice and Charts
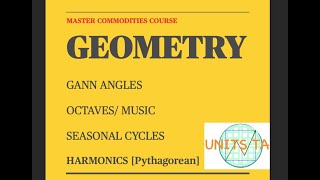
English WD Gann Master Commodities Course: Geometry: Gann Angles/ Octaves/ Harmonics/ Seasonal Cycle

English WD Gann Master Commodities Course Hidden Rules PartVIII Bible Interpretation

English WD Gann Master Commodities Course Hidden Rules PartVII Squaring Time and Price Three Methods

English WD Gann Master Commodities Course Hidden Rules Part VI Master Chart Twelve

English WD Gann Master Commodities Course Hidden Rules Part V War Cycles

English WD Gann Master Commodities Course Hidden Rules Part IV May Wheat:Great Time Cycles Enneagram

English WD Gann Master Commodities Course Hidden Rules Part III May Rye and Corn: Enneagram

English WD Gann Master Commodities Course Hidden Rules Part II May Corn: Market Structure

English WD Gann Master Commodities Course Part I : Hidden Rules

Numerology WD Gann Trading Technique: Number: 5 by Numerologist: Sheetl Sood

Bull or Bear Cycle Current Status of market: WD Gann Nifty, Bank Nifty Monthly and Daily time Frame

Intrady Trade Nifty 28 2 2025

Numerology WD Gann Numerology Sepharial Kabala of Numbers Part-I Recommended Reading List

Numerology WD Gann Trading Technique: Number: 4 by Numerologist: Sheetl Sood

Numerology WD Gann Trading Technique: Number: 3 by Numerologist: Sheetl Sood

Numerology WD Gann Ariel Yvon Taylor Numerology Made Plain: Recommended Reading List

Numerology WD Gann Trading Technique: Number: 2 by Numerologist: Sheetl Sood

Numerology WD Gann Trading Technique: Number: 1 by Numerologist: Sheetl Sood

Numerology WD Gann The Mysteries of Sound and Number: Sheikh Habeeb Ahmed: Recommended Reading List

Numerology WD Gann Trading Technique: Numerologist: Sheetl Sood

Numerology WD Gann Trading Technique: Recommended Reading List: Books on Sale