Project Management Solutions

Creating Excel Charts in Project Management

Sample Excel Charts for Construction Project Management

Advantages of applying Pivot Table and Pivot Charts in Excel Part 4

Advantages of applying Pivot Table and Pivot Charts in Excel Part 3

Advantages of applying Pivot Table and Pivot Charts in Excel Part 2

Advantages of applying Pivot Table and Pivot Charts in Excel

Highlighting the filtered alternative rows in Excel

Summation of Every Nth Rows in Excel

Economic Order Quantity EOQ model created in Excel

Advance Vlookup used in Excel

Conditional Formatting Tutorial in Excel

Sorting Business Portfolios of a Company in Excel

Budgeted Percentage of the Business Portfolios in Excel

Highlighting the search string in Conditional Formatting of Excel

Highlighting Dates by Conditional Formatting of Excel

Narrow down World Cup 2022 winner by Data Validation in Excel

Conditional formatting of Excel Chart part 2

Conditional formatting of Excel Chart

Sum by Union and Intersection tutorial in Excel

Just Copy Numbers in Excel from a Column that has Text and Numbers

Converting a Photo Image file into Excel Data File

Drill Down and Tooltips in Power BI

Merging Columns of various sheets in Excel of Primavera P6's Output

Fill Color in indented rows in Excel like Primavera P6

How to create a video of a PowerPoint presentation

Using Shape and Scoll Bar in Excel

Historical events presentation in Excel from time to time

Circular Bullet Chart in Excel for Project Controlling

How to hide or unhide all blank rows and columns
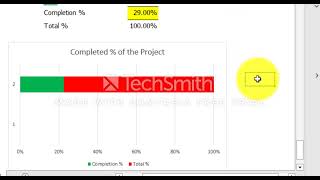
Stacked Bar Chart for the Completed Percentage of Activities