Linknet Analytics
Welcome to 'Linknet Analytics' channel, where we explore the Power of Business Intelligence & Analytics in an educational and informative way. Our primary goal is to get actionable insights from the raw data, by using a range of tools, technologies and processes. Stay ahead of the curve and subscribe to our channel

Узнайте, как интегрировать Claude AI и Power BI Modeling MCP Server 🤔 Пошаговые объяснения☑️

Power BI ✨ Как добавить столбец из примеров в Power Query 🤔 Что такое алгоритм искусственного инт...

Проект Power BI ⭐️ Обучение за 25 минут ➡️ Полный цикл ⭐️ Uber Data ⭐️ От необработанных данных д...

Приложение Python Streamlit ☑️ Узнайте, как создать эту интерактивную панель управления ⭐️ Uber D...

Проект Python Pandas 🐼 🐼 Менее 30 минут ➡️ Данные Uber (файл CSV) ⭐️ Это видео 1 из 2

Power BI 👉 On-Premises Data Gateways 🤔 Install & Configure ➡️ Refresh the Data ( MSSQL , Python )

Learn Pandas in 20 minutes 🐼🐼 A Python Library ✨ A Quick Introduction to the basic concepts ✅

37 Minute Power BI Project ✅ End to End ➡️ How to Transform Webpage Data To Stunning Report 🤔

Power BI ✨User Data Functions ➡️ Build a Compound Interest Calculator ✨Action from within Report ☑️

Learn in 6 minutes ☑️ Publish a Power BI Report to the Power BI Service ✨Step-by-Step Walkthrough ✨✨

From Static to Dynamic ✨ Visual Title ➡️ Get Multiple Values, based on Slicer Selections ✅ Power BI✨

Power BI 🌟 Real World Data ✨Stack Overflow Developer Survey data 💫 Report Page in 30 minutes ✅

Discover the Magic of Number 4 (a black hole ?) Count letters in Words ➡️ Spell ➡️ Count | Power BI

Using Real World Data ➡️ Power BI 🖥️ Build an Interactive Dashboard in 30 minutes✨ Stunning Viz✨

Power BI 🖥️ | Compare Selected Year Versus All Other Years✨ | SUMX,RANKX,FILTER,CALCULATE

Power BI 🖥️| Running Total | 3 Simple & Easy Methods | With Reset | Relative Date Slicer | Dynamic✨

Power BI 🖥️| DAX Functions: FIRSTDATE, LASTDATE, DATEDIFF |Number of days since Last Date Measure‼️

Power BI 🖥️| Find New & Repeat | Create Calculated Column | Simple Method | Stunning Report Page✨

Using Power Query,Split & Merge Time Column into Hour(AM/PM) column | Create a Stunning Report Page✨

Using Real World Data➡️Power BI 🖥️ Per Capita Measure| Previous Month| Month over Month Change as %

Power BI 🖥️| DAX functions SUMX , OR , AND| Measures for values Weekends & Weekdays| Report Page✨✨

Power BI ➡️ Dynamic Visual Calculation |Simple Moving Average | MACD | What if Parameter ✨✨

Power BI | Using Real World Data| Highlight MAX & MIN | Clustered Column Chart| Conditional Format📊📊

Power BI | using Real World Data| Map| Calendar Table |Tooltip page| DATEDIFF |Days between 2 dates✨

Create Power BI Report Pages using Real World Data | 311 Service Requests | Little Rock ,AR, USA✨✨✨

Pareto Rule 80/20 Analysis using Microsoft Power BI🖥️| World Population Data from countrymeters.info

Pareto Rule 80/20 Analysis using Python(Jupyter Notebook) |World Population Data |Countrymeters.info

Simple Linear Regression| Using Power BI🖥️, Python & Excel | LINESTX | RMSE | Dynamic Report pages✨

How to find 'Mode' using Microsoft Power BI? | Descriptive Statistics | DAX Measure
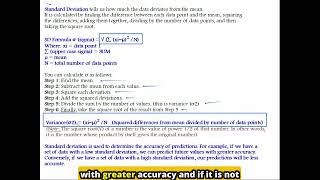
What is Standard Deviation? | A quick summary