Видео ютуба по тегу Plotly

Visualizing Unique Values in a Pandas DataFrame: A Guide to Plotly's go.Figure

Understanding the Plotly and Dash Mixed Graphs: Why Do They Break with hline or vline?

Dynamically Change Filename in Dash for Your Plots dash, plotly, python

Python 3 Plotly Script to Create Interactive Visualization Charts From JSON Data in Browser
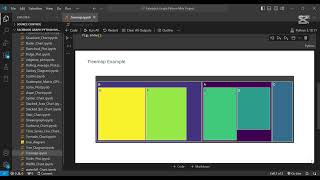
Create Stunning Treemaps in Python with Plotly | Data Visualization Tutorial | Step-by-Step Guide

App Studio Dash App in 10 Lines of Code

Mastering Plotly Gantt Charts: A Step-by-Step Guide | Part 8

5. 📈 MAG 7 Stocks: 5-Year Cumulative Return Analysis with Python & Plotly! 💹

Unleash the Power of Data Visualization Combine Matplotlib, Seaborn, and Plotly! 📊✨

FastAPI Fitness Dashboard: Visualize Fitbit Heart Rate Zones with Plotly | Part 3

Python Plotly Dash | Complete Course with Demo

How to Hide Plotly Output in Python Flask Applications

📊 Histogram Plot Using Plotly in Python | Data Visualization Tutorial
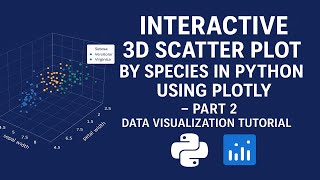
Filter Species in 3D Scatter Plot Using Plotly in Python – Part 2 | Data Visualization Tutorial

Matplotlib vs Seaborn vs Plotly - Data Visualization

How to Shade Area Between Two Curves in Plotly: A Step-by-Step Guide

Episode 7 - GCP Chess Data Pipeline | Plotly Dash BigQuery Monitor

34/22. Capstone Project on Neighborhood Resource Equity Dashboard With Plotly

Plotly Graphs with App Studio

📊 Build an Interactive Dashboard in Plotly Dash – No JavaScript Needed!