How to turn an Excel Into a Live Dashboard Website (ChatGPT + Replit Easy Workflow)
Автор: Moe Lueker
Загружено: 2025-12-29
Просмотров: 5036
Try Replit (build and publish your dashboard fast): https://replit.com/refer/moelueker
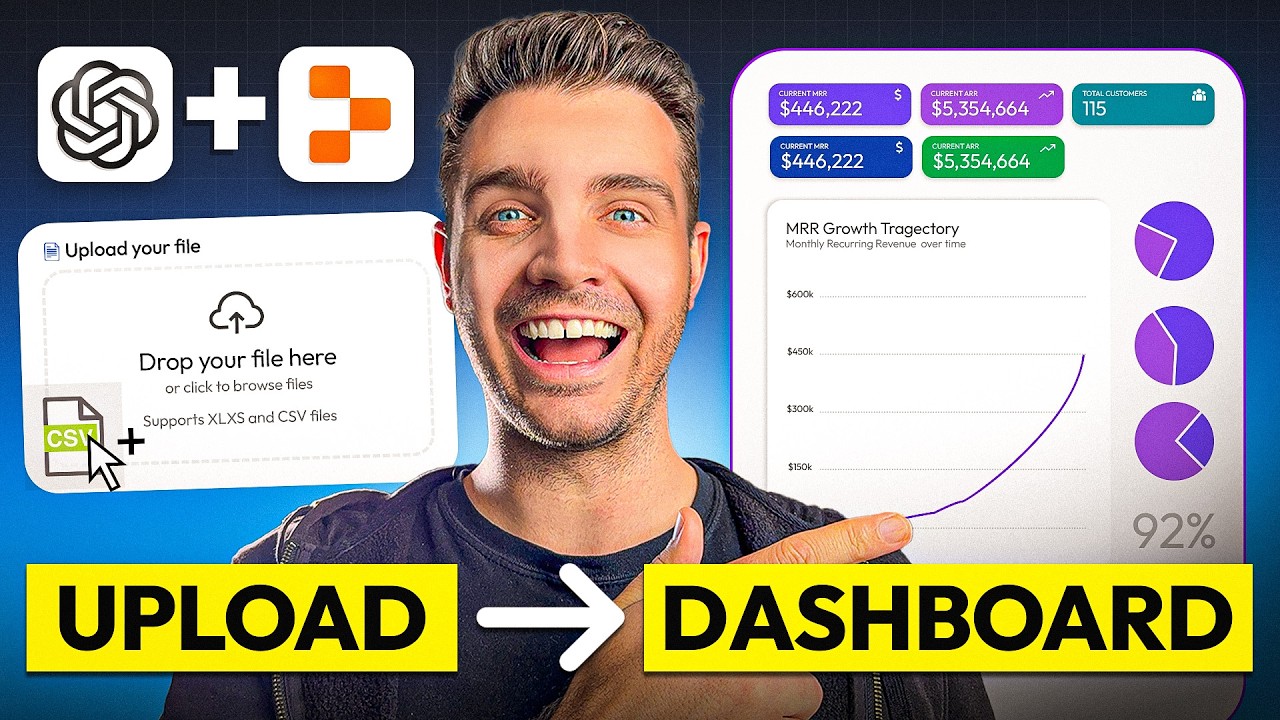
Stop sending static Excel files to investors, partners, clients, or your team. In this video, I show you how to turn an Excel spreadsheet into a live dashboard website inside ChatGPT using Replit, then publish it as a shareable link in a few clicks.
This is perfect if you want Excel data visualization that actually looks good on mobile, is easy to understand, and is simple to share as a website instead of emailing spreadsheets back and forth.
🔗 RESOURCES:
• Try Replit: https://replit.com/refer/moelueker
• Download my SaaS business model / financial template (Excel): https://moelueker.gumroad.com/l/free-...
• Prompts I used to generate the dashboards (copy and paste): https://moelueker.gumroad.com/l/chatg...
• Live dashboard demo link (Dashboard #1): https://moelueker-saas-dashboard-exam...
• Live dashboard demo link (Forecast builder + dashboard): https://Saas-financial-model.replit.app
Turn Excel Into a Live Dashboard Website (ChatGPT + Replit):
In the walkthrough, I upload a SaaS financial model, generate two dashboard versions, add features like time range filters and dark mode, then publish everything as a live dashboard website. I also show why clean headers matter when using AI for spreadsheet dashboards, so your charts and metrics do not come out wrong.
This video covers:
ChatGPT Replit, Replit in ChatGPT, Replit ChatGPT app, Excel data visualization, spreadsheet dashboard, convert Excel to website, interactive dashboard, data dashboard website, and a simple forecast builder you can use from a browser.
🔍 KEY TAKEAWAYS:
• How to use Replit inside ChatGPT to generate a working dashboard from an Excel or CSV
• The simplest way to structure your spreadsheet so AI reads it correctly (clean headers)
• How to iterate on the dashboard features (filters, themes, time ranges, uploads)
• How to publish your dashboard as a live website link in Replit
• How to upgrade the dashboard into a lightweight business forecast builder
📈 TIPS FOR BETTER DASHBOARDS:
• Keep your data in one clean table with consistent column names and clean headers
• Start with the simplest version first, then iterate with follow-up prompts
• Ask for a time range selector, KPI cards, and a CSV upload button to make it reusable
• If something breaks, paste the error back into ChatGPT and ask for a fix
• Publish as a static site when possible if you do not need a database
🎥 SUBSCRIBE, LIKE & COMMENT:
If you want more videos on AI business systems that actually work, subscribe and comment what spreadsheet you want to turn into a dashboard website next.
❤️ LOVED THIS VIDEO?:
You’d make my day if you support this type of content by buying me a coffee 🤩
https://moelueker.com/support/
CHAPTERS:
00:00 Stop Sending Excel Files (Do This Instead)
01:19 SaaS Financial Model Template Overview (Data Source)
01:56 The Secret to Accurate AI Dashboards: Clean Headers
02:20 Connect Replit Inside ChatGPT (Replit in ChatGPT Setup)
03:23 Prompt @Replit to Build an Interactive Dashboard From Excel/CSV
05:39 ChatGPT Analysis: Key Metrics + J-Curve Story (MRR, EBITDA, Runway)
07:12 Dashboard #1 vs Dashboard #2 (Which One Is Better?)
09:47 Upload New Excel/CSV and Watch the Dashboard Update Live
11:37 Edit the Dashboard in Replit (Time Filters, UI Changes, Dark Mode)
16:37 Publish Your Replit Dashboard as a Live Website Link (Replit Deploy)
#replit #chatgpt #exceldashboard
Доступные форматы для скачивания:
Скачать видео mp4
-
Информация по загрузке:


![Камеди клаб [НОВЫЙ 2026] [full HD] Сборник избранных смешных и юмористических эпизодов | часть 5](https://image.4k-video.ru/id-video/hFezUJlKMmM)