だめな事例から学ぶデータ可視化のテクニック
Автор: OCW Tsukuba
Загружено: 2024-10-30
Просмотров: 661
だめな事例から学ぶデータ可視化のテクニック
Data Visualization Techniques Learned from Bad Cases
--------------------------------------------------------------
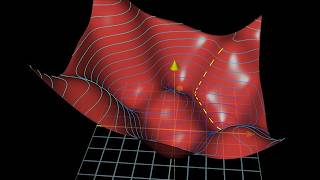
データ可視化とは、データを人に見せるために表現を変えることです。データの視覚的表現を人に見せることで、データの理解、発見、洞察を助けることが可能になります。しかしながら、そのような目的に役立たないダメな可視化を見掛けることも多々あります。この講義では、ダメな事例を通して、人間の視覚特性、対象データ、視覚的な表現手法の関係を紹介し、それらの関係を意識することの重要性を説明します。
Data visualization is the process of changing the representation of data to make it visible to people. By presenting a visual representation of data to people, it can help them understand, discover, and gain insight into the data. However, we often find bad visualizations that do not serve these purposes. In this talk, I will use bad examples to introduce the relationships between human visual characteristics, target data, and visual representation techniques, and explain the importance of being aware of these relationships.
--------------------------------------------------------------
三末 和男 教授(筑波大学システム情報系情報工学域)
Kazuo Misue(Department of Computer Science, Institute of Systems and Information Engineering)

Доступные форматы для скачивания:
Скачать видео mp4
-
Информация по загрузке: