Скачать
SPSS - Paired-samples t-test (2 of 2) - creating a bar graph
Автор: Doug Maynard
Загружено: 2013-09-18
Просмотров: 77473
Описание:
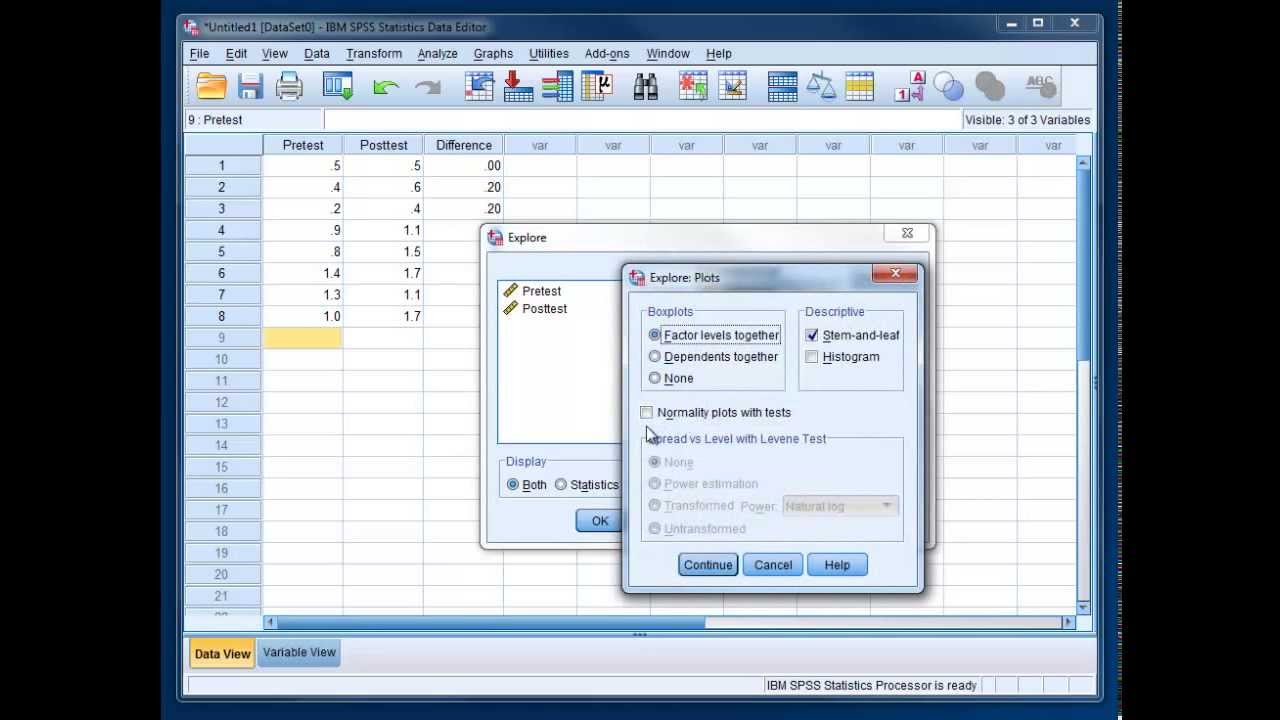
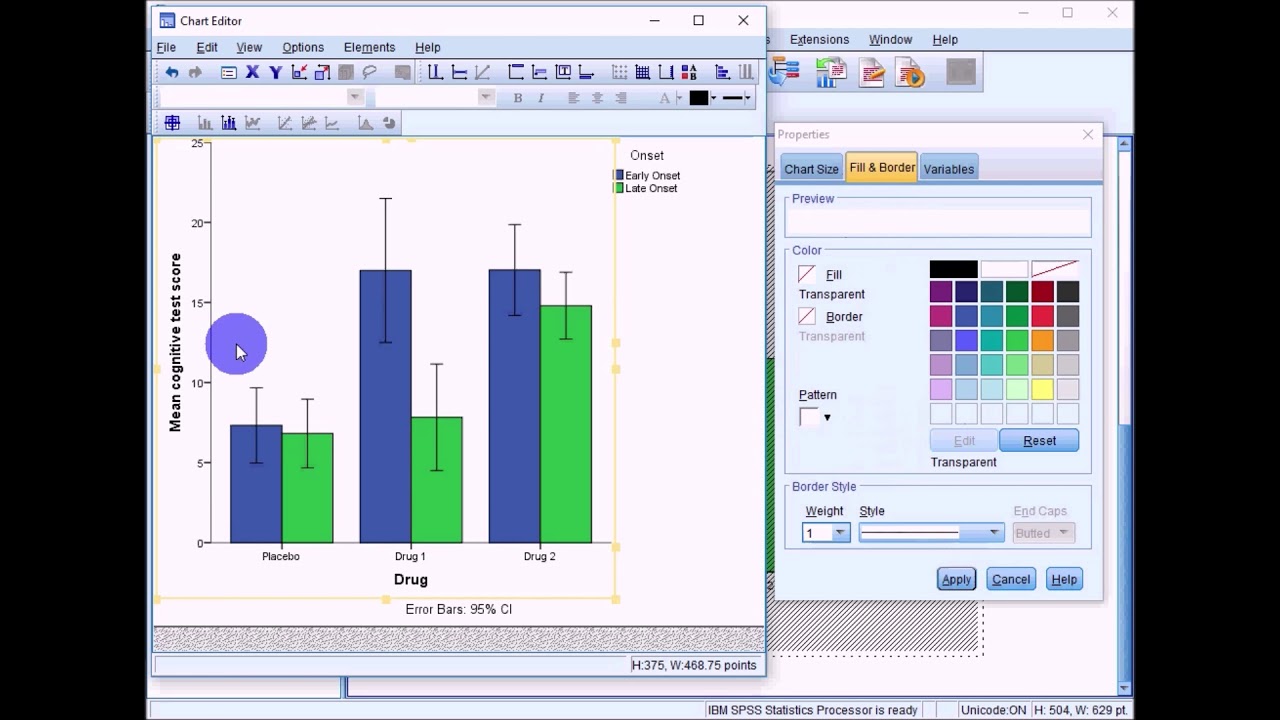
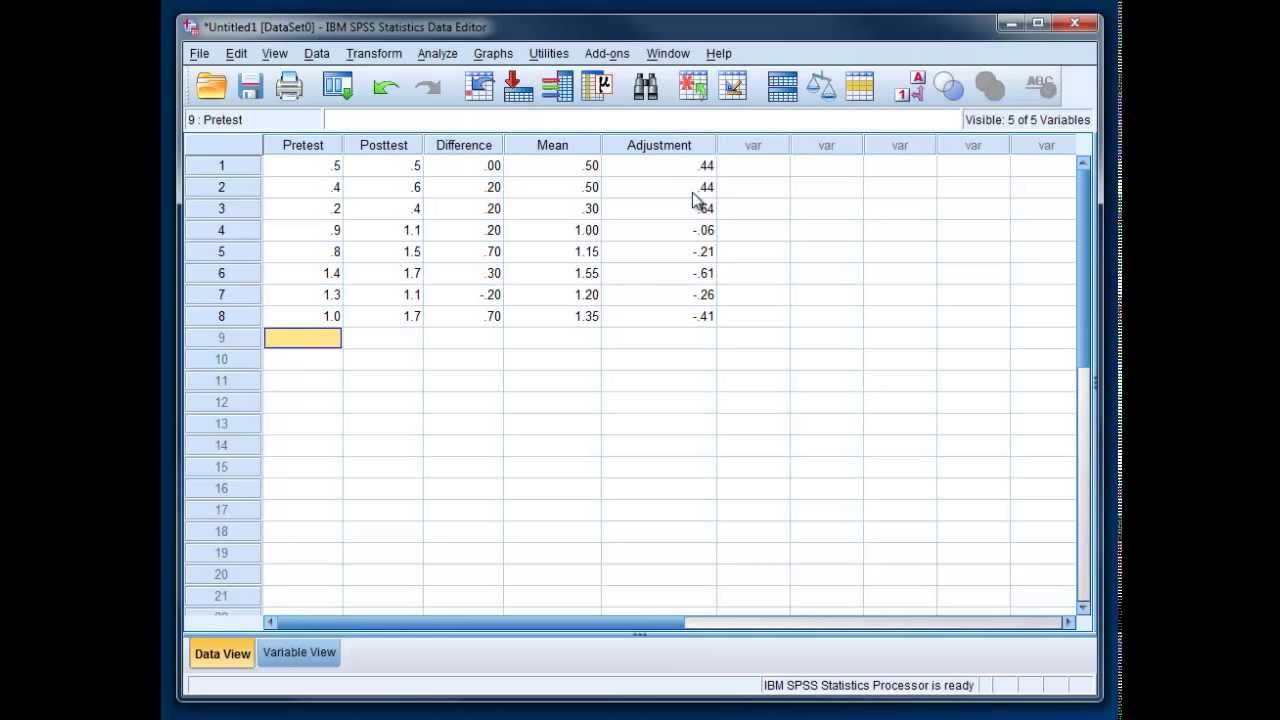
In this video we produce a bar graph of results from a paired-samples t-test with appropriate error bars. By default, SPSS gives you error bars which assume that groups are unrelated, which is not true for this design.
(In the previous video, we used SPSS v21 to conduct a paired-samples t-test (a.k.a. dependent t-test or repeated-measures t-test). We also tested for normality.)
Доступные форматы для скачивания:
Скачать видео mp4
-
Информация по загрузке: