Скачать
SOS 212: Lecture B2 (2022-01-25): Causal Loop Diagrams in Vensim
Автор: Ted Pavlic
Загружено: 2022-01-26
Просмотров: 641
Описание:
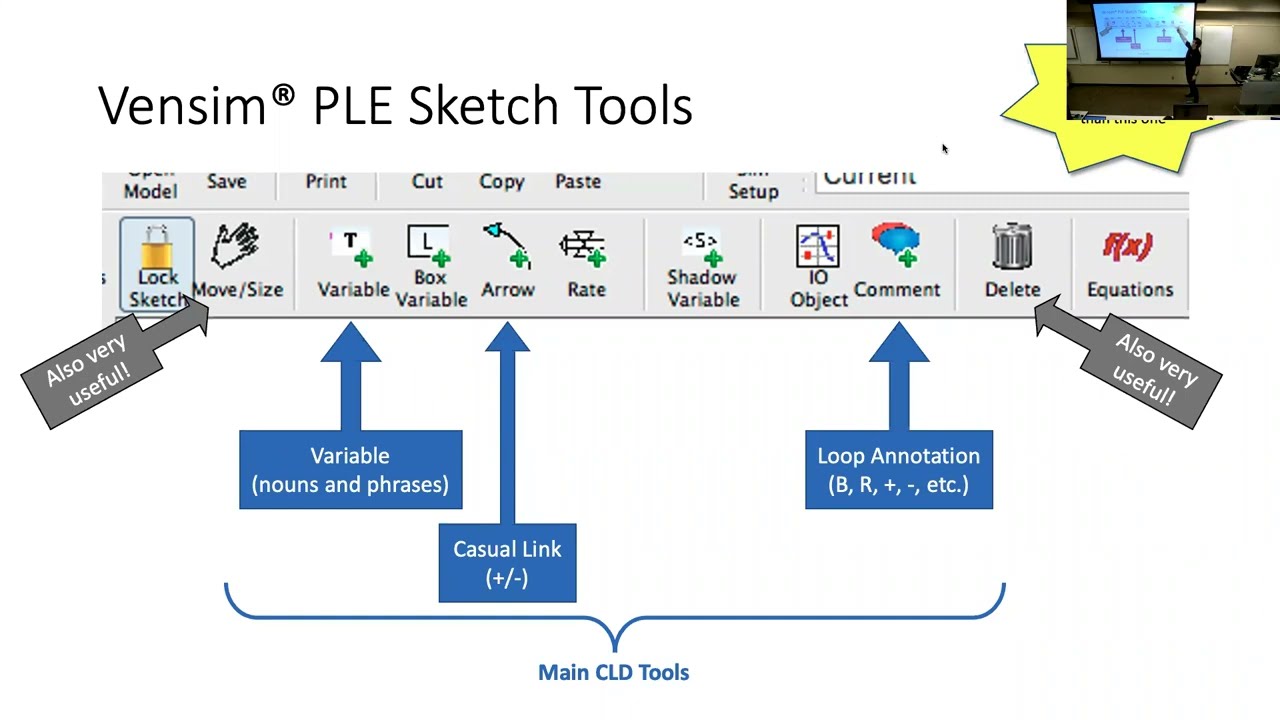
In this lecture, we introduce (via hands-on tutorial) the program Vensim PLE by Ventana Systems and how to use it to draw Causal Loop Diagrams (CLDs). We then review how to draw and edit CLD's in general and introduce a homework assignment where students will have to draw and annotate complex CLD's in Vensim.
This lecture was recorded by Theodore Pavlic as part of SOS 212 (Systems, Dynamics, and Sustainability) at Arizona State University.
Доступные форматы для скачивания:
Скачать видео mp4
-
Информация по загрузке:


![Балансирующие циклы [Климатический лидер]](https://imager.clipsaver.ru/vmcunCwX6Fc/max.jpg)