Feature Explained: Dashboards Live Demo - Data Visualization & Control for IoT Setup
Автор: Blynk
Загружено: 2025-02-28
Просмотров: 4788
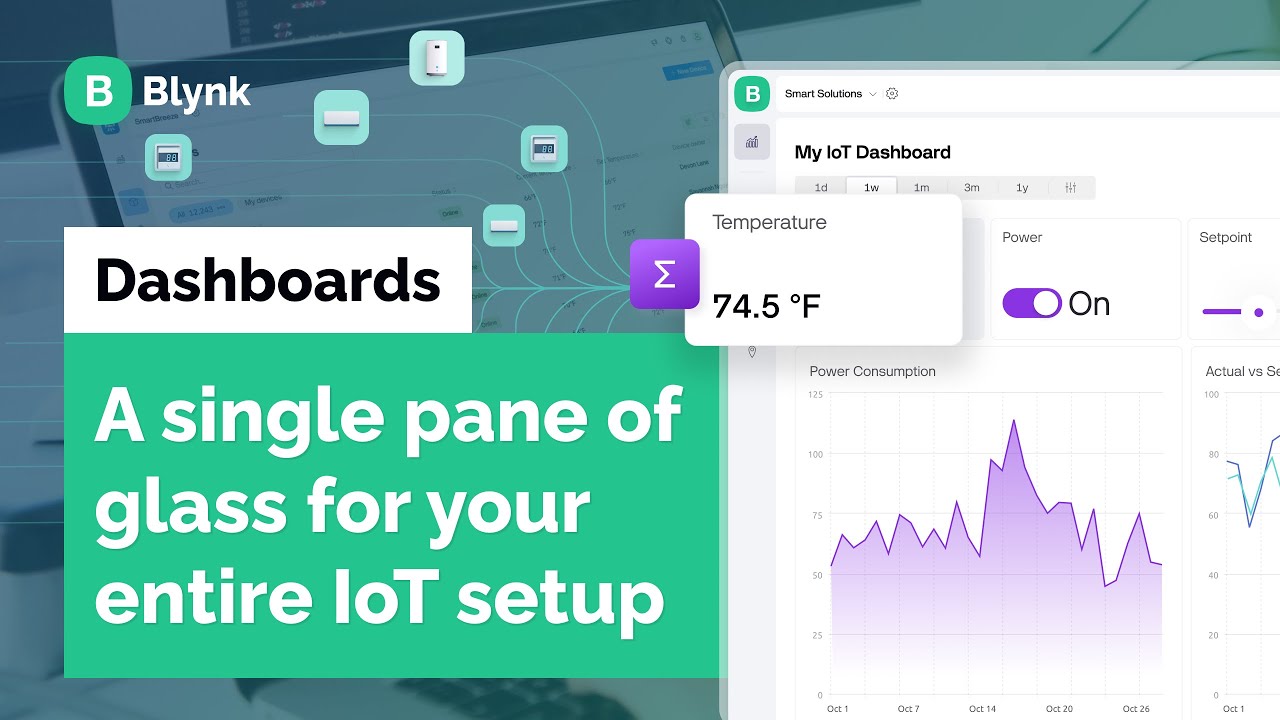
A fully no-code solution for aggregating, analyzing, and managing data from your entire fleet including multiple device types in one intuitive interface.
What You Can Do with Blynk Dashboards:
✔ Visualize data from multiple devices in a single view
✔ Aggregate key metrics for better insights
✔ Control devices in bulk
✔ View all your devices/products or any subset
00:00 Why Dashboards Matter
01:15 Live Device Control and Sync Logic
03:26 Real-Time + Historical Data
04:11 Choosing What Devices to Show (Templates, Orgs, Tags)
05:48 Events and Alerts in Real Time
07:56 Filtering and Segmentation (Widgets and Devices)
09:07 Fleet Analytics and Device Performance
10:15 What’s Coming: Maps and Tables
12:20 Reusing Dashboards Across Clients
14:00 Building and Customizing Dashboards
27:00 Final Recap and Key Takeaways
🔗 Learn more: https://blynk.io/blog/gain-a-holistic...
📖 Documentation: https://docs.blynk.io/en/blynk.consol...
🚀 Sign up for a free account: https://blynk.cloud
🌍 Official website: https://blynk.io
/ b-l-y-n-k
/ blynk_app
/ blynkapp
💡 Like & Subscribe for more IoT updates! 🚀
#BlynkDashboards #IoTDashboards #NoCodeIoT #IoTManagement #DataVisualization #livedemo #walkthrough
Доступные форматы для скачивания:
Скачать видео mp4
-
Информация по загрузке: