Скачать
From Gantt Chart Grumbles to Greatness: A SAS Visual Analytics Tip
Автор: Sundaresh Sankaran
Загружено: 2026-01-08
Просмотров: 17
Описание:
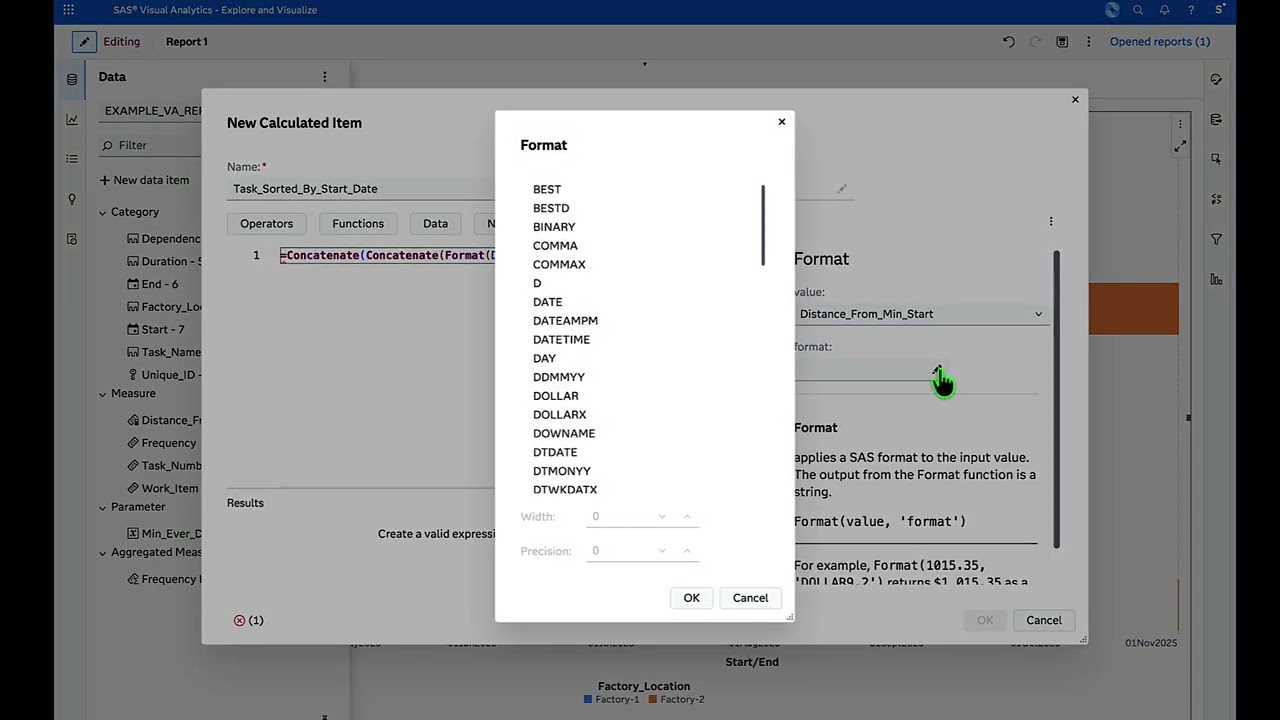
The Schedule chart, the closest element to a Gantt chart in SAS Visual Analytics is extremely easy to configure but does not offer an easy sort function to ensure tasks show up in sequential order. Here's a workaround, all credit to Renato.Luppi@sas.com for the idea, which is very easy to implement and does not take you back to the data drawing board.
Доступные форматы для скачивания:
Скачать видео mp4
-
Информация по загрузке: