Multiple Regression in Excel - P-Value; R-Square; Beta Weight; ANOVA table (Part 1 of 3)
Автор: Quantitative Specialists
Загружено: 2014-10-07
Просмотров: 58056
Check out our new Excel Data Analysis text:
https://www.amazon.com/dp/B076FNTZCV
This video illustrates how to perform a multiple regression statistical analysis in Microsoft Excel using the Data Analysis ToolPak.
Multiple regression in Excel
Regression Analysis
Statistical Analysis in Excel
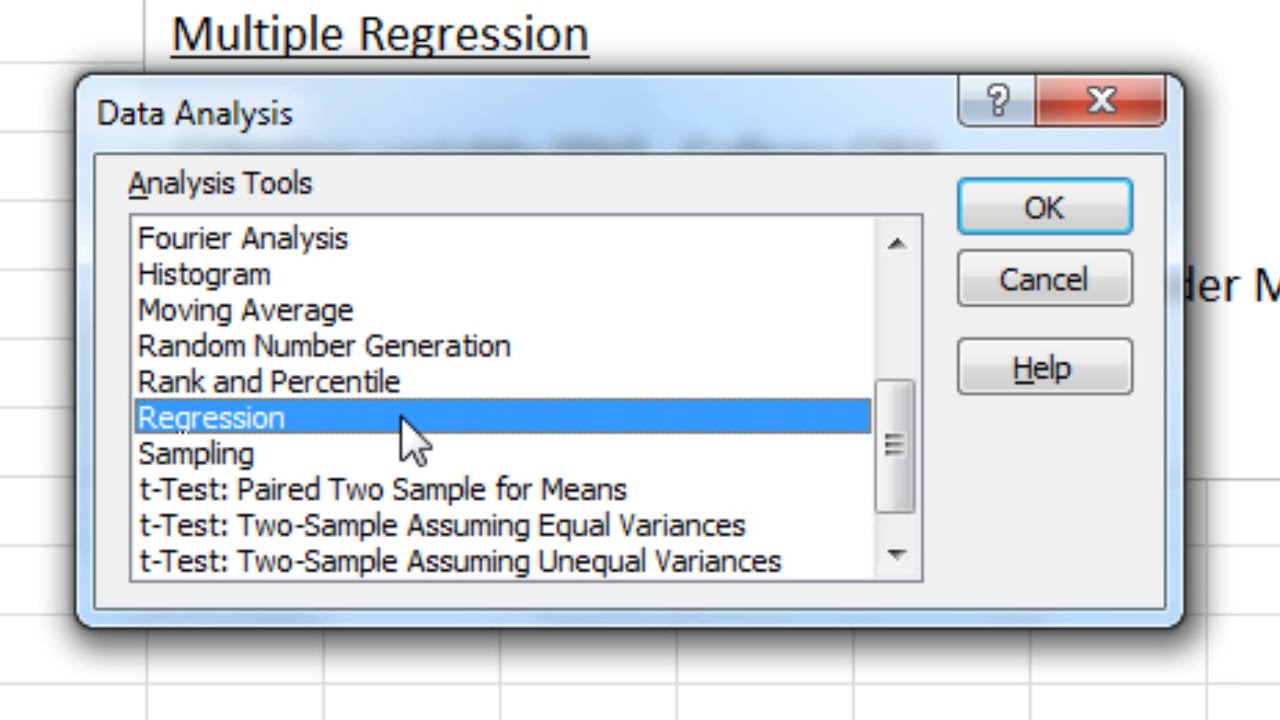
Video Transcript: In this video we'll take a look at how to run a multiple regression analysis in Microsoft Excel. Now in this example, notice that we have four variables: college GPA, and that's the GPA after the first year in college, and then we have SAT score, which was taken in high school, and we have social support, and this was a measure of how supported people feel, to what degree they can turn to others for support, and this was also assessed in college, and then we have gender, where we have 1s and 2s, where 1s are males and 2s are females. So in this example, we have a total of four variables and we have 30 rows of data here. And in regression, each row corresponds, most typically, to a different person. So, for example, the first person had a GPA of 3.45 after their first year in college, they had a 1200 on the SAT, a 62 on social support, and they were male, they had a 1 on gender. Now in multiple regression, we have two different kinds of variables, we have the criterion variable, which is also known as the dependent variable, and in this example the criterion variable is college GPA. And then we have predictor variables, and those are also known as independent variables. Here we have 3: SAT score, social support, and gender. And, in multiple regression, we are always going to have at least two predictor variables, or independent variables, and only one criterion variable, or dependent variable. So it's important to get used to this terminology when you're using multiple regression as it can get a little confusing otherwise. So, once again, college GPA is our criterion variable, or our dependent variable, and these three variables are our predictors, or our independent variables. And what we're trying to do in multiple regression is we're trying to use these predictors, SAT score, social support, and gender, to predict our criterion variable, college GPA. And that's at the end of the first year in college once again. And there's one other thing I do want to note here, I have a dichotomous variable here, gender. Of course for gender, there's two values males and females. And that's fine, if I have a dichotomous variable, I can go ahead and enter that into regression as normal. But if I have a categorical variable that has more than two categories, like say ethnicity, let's say we had four categories in ethnicity, I can't just go ahead and enter that as a normal predictor, but instead I have to recode that where I have to have as many predictors for ethnicity as are equal to the number categories minus one. So if I have, for example, four categories of ethnicity, I would need to create three predictors for ethnicity alone so they would be ethnicity 1, ethnicity 2, ethnicity 3, just for that variable. And how to do that is beyond the scope of this video, but it is important to be aware of. So if you do have a categorical variable that has more than two categories you don't want to just go ahead and enter it into the normal multiple regression commands as we're going to do here in Excel. It needs to be re-expressed. But we're good to go with gender, because there's just two categories, or in other words it's dichotomous. OK so let's go ahead and get started. To run the multiple regression in Microsoft Excel, we want to go to Data and then select Data Analysis. And then the Data Analysis window opens. We want to go ahead and scroll down to find Regression. Select that and then click OK. Now here for Input Y range, Y corresponds to our criterion variable, and X corresponds to our predictors. So let's go ahead and start with our Y, since the cursor's flashing in that box. Go ahead and select college GPA and scroll all the way down to select all the values. Then we see B1 through B31 in that box. That looks good. Go ahead and make sure now that you click on the Input X range box, so that it's active. And then now we'll select our three variables and all the values for SAT score, social support, and gender. OK that looks good. So now I have C1 through E31, that's perfect. Next, notice that I did select my labels which I wanted to do. I have the variable names there. So I'm going to go ahead and click on Labels. OK and everything else looks good, so go ahead and click OK. And then here we get our output and it's a little bit compressed so let's go ahead and modify this. First, let's go and change the font to 13 point. And then I'm going to go ahead and expand this by double- clicking on these columns here; that looks good.
YouTube Channel (Quantitative Specialists): / statisticsinstructor
Subscribe today!
Доступные форматы для скачивания:
Скачать видео mp4
-
Информация по загрузке:


