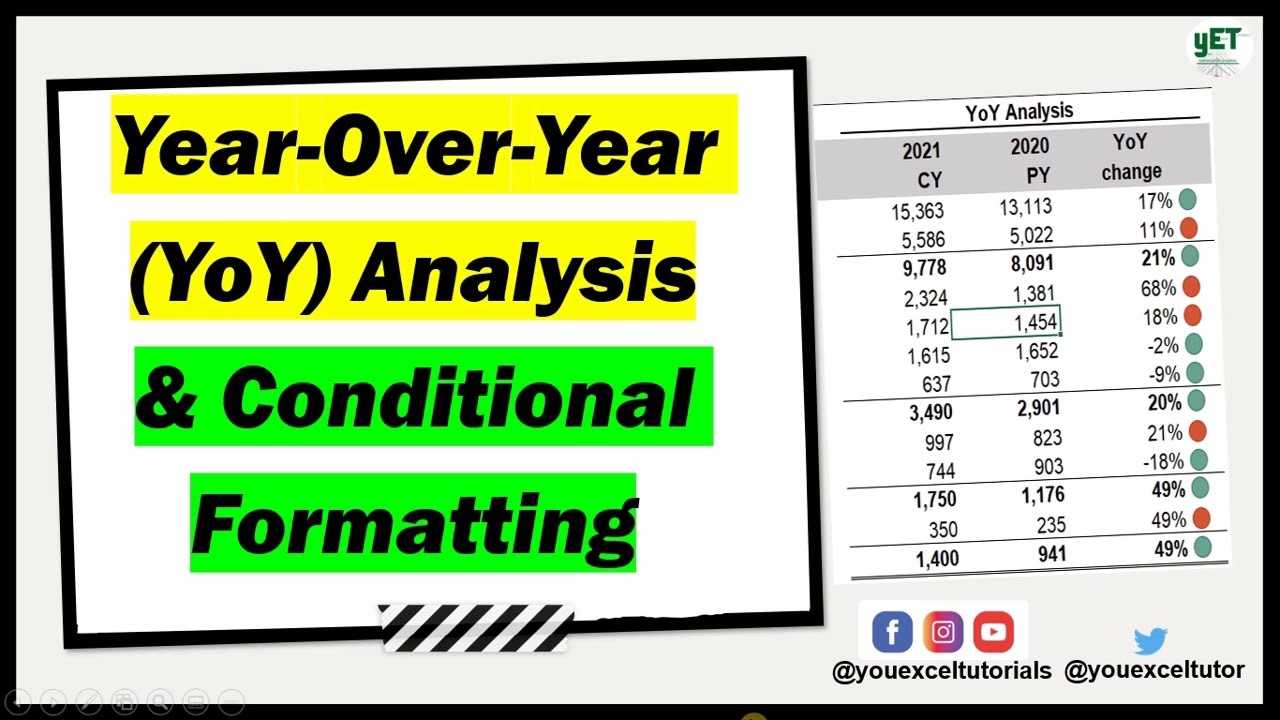
Year-Over-Year (YoY) analysis in Excel || Conditional Formatting Icon Sets || Company Performance
Автор: YouExcel Tutorials
Загружено: 2021-06-07
Просмотров: 2457
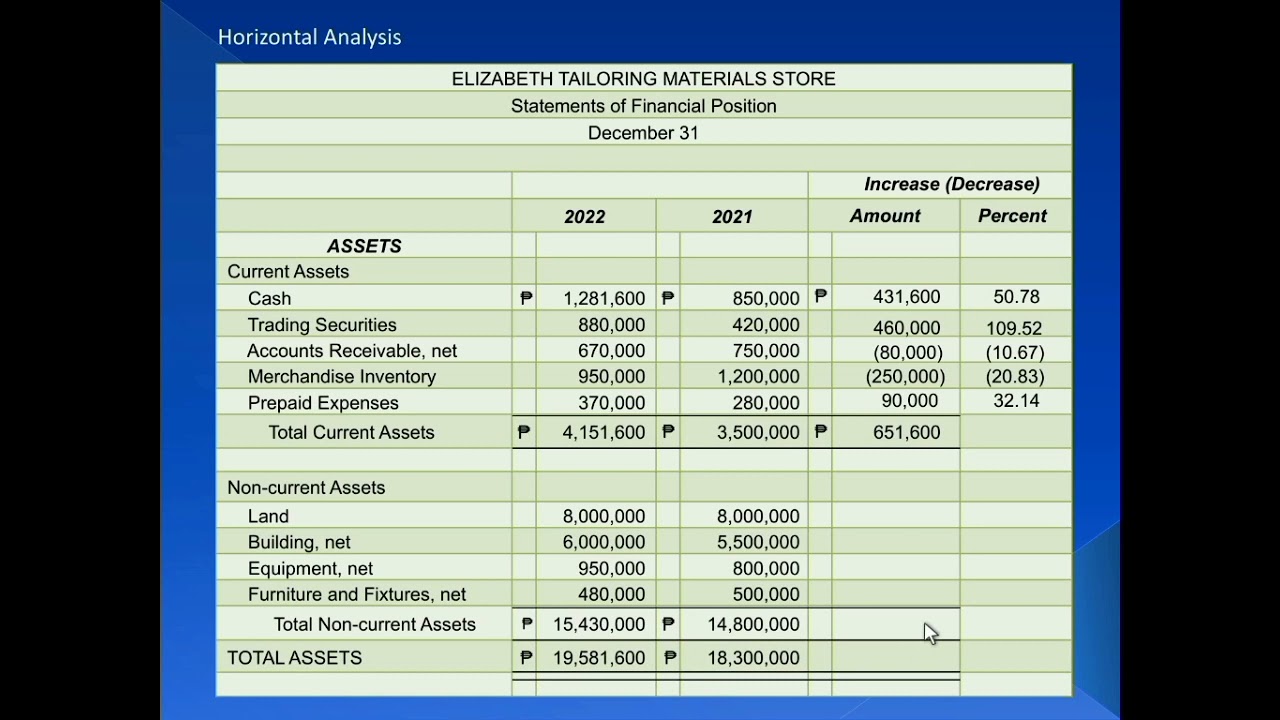
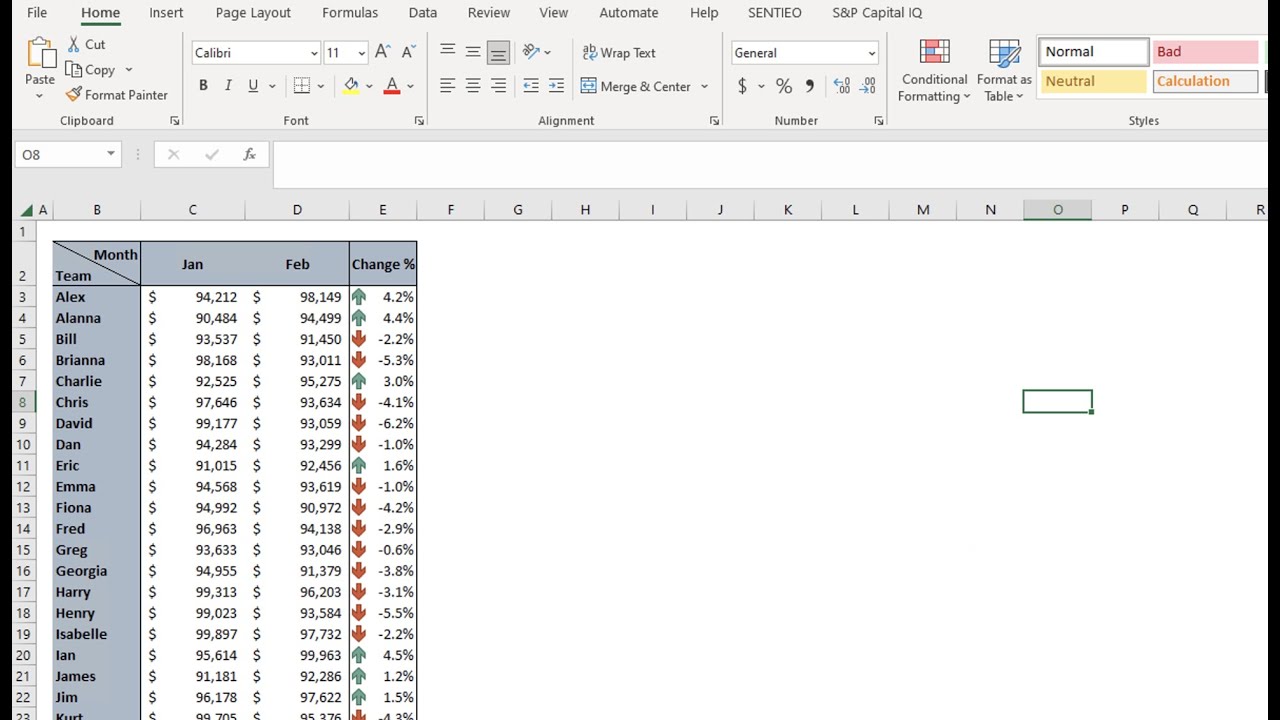
This video describes Year-Over-Year (YoY) analysis and how to visually represent the result with icons using conditional formatting. If you are in finance/ accounting or an analyst or a small business owner or an investor, you need to use YoY analysis to assess the performance of a company.
Please check out other videos on my channel and don't forget to like, share, subscribe and click the bell icon so you'll get a notification when the next video is uploaded. Thanks!
Connect with me on:
👉Instagram and Facebook @youexceltutorials
👉Twitter @youexceltutor
👉LinkedIn @bunmisanusi
🎬Check these videos
Common Size (Vertical) Analysis in Excel • Common Size (Vertical) Analysis in Excel |...
Simple Actual to Budget Charts • Simple Actual to Budget Charts
Download the workbook here https://drive.google.com/file/d/1Nfbi...
📢“God resists you when you are proud but continually pours out grace when you are humble” James 4:6b (TPT)
#msexcel #youexceltutorials
Доступные форматы для скачивания:
Скачать видео mp4
-
Информация по загрузке: