Master Basic Plots in R with ggplot2 | RStudio 2025 Visualization Tutorial
Автор: Skills Station
Загружено: 2025-06-20
Просмотров: 201
📊 RStudio 2025 Course: Basic Plots in R using ggplot2 | Complete Data Visualization Guide**
Welcome to the *RStudio 2025 course* on **Statistical Data Analysis and Visualization in R**!
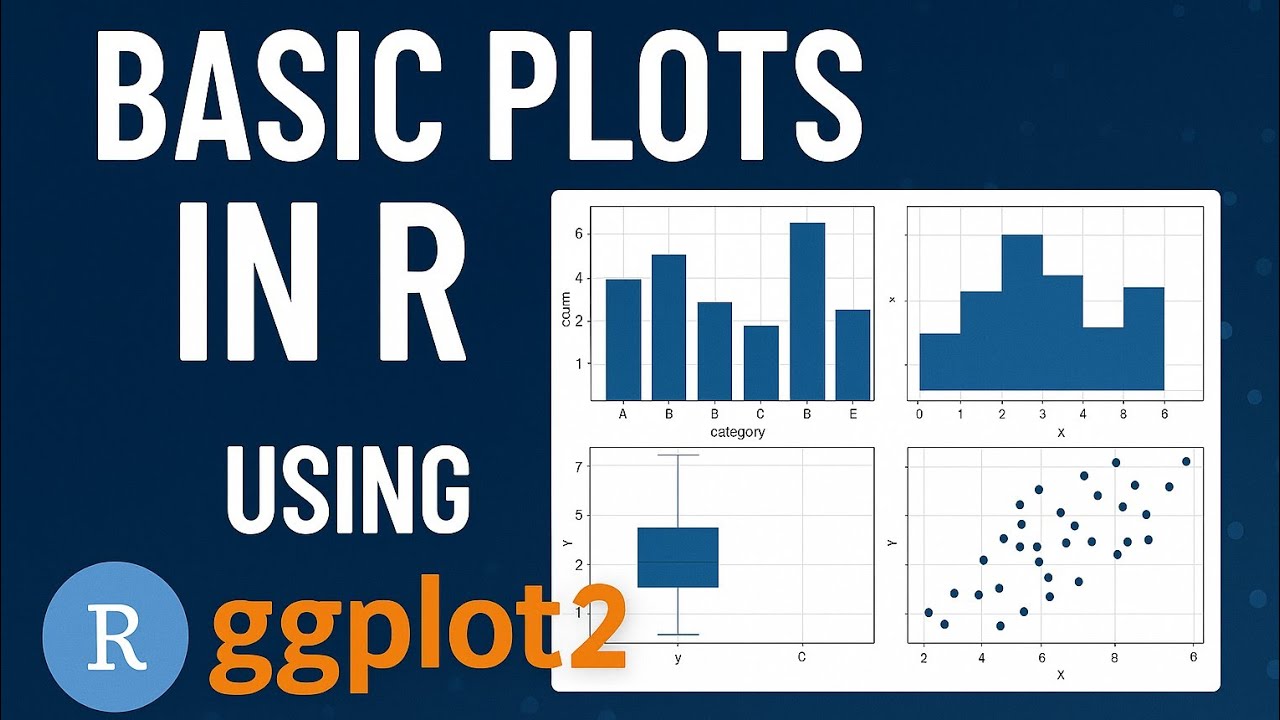
In this video, you’ll learn how to create **different basic plots in R using the powerful `ggplot2` package**. Ideal for students, data science beginners, and professionals looking to enhance their data visualization skills.
✅ What you’ll learn in this tutorial:
How to create a *Bar Plot* in ggplot2
How to make a *Histogram*
Step-by-step guide to draw a *Boxplot*
Easy way to build a *Line Plot*
Create a customized *Scatter Plot (Point Plot)*
Use of color, labels, themes, and more!
With real examples and beginner-friendly instructions, this video helps you master the essentials of *data visualization in RStudio* using `ggplot2`.
🎥 Perfect for learners of:
Data Science
Statistics
Machine Learning
Academic Research
R Programming
🔔 Don’t forget to *Subscribe* for more tutorials on **RStudio, R programming, ggplot2, and data analysis**.
#RStudio2025 #ggplot2 #ataVisualization #BasicPlots #BarPlot #LinePlot #Histogram #Boxplot #PointPlot #RProgramming #LearnR #RStudioTutorial #DataScienceWithR #StatisticalAnalysis #ggplot2Tutorial #RForBeginners #RStudioCourse #DataAnalytics #VisualizeWithR
Доступные форматы для скачивания:
Скачать видео mp4
-
Информация по загрузке: