Скачать
QRM 5-1: Tails in Data - MS Plot and Concentration Profile
Автор: The Logic of Risk
Загружено: 2020-05-09
Просмотров: 1608
Описание:
Welcome to Quantitative Risk Management (QRM).
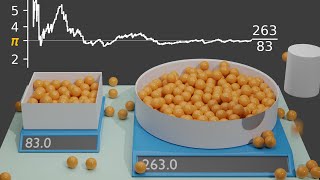
Let us continue our discussion about the graphical tools we can use to study tails. We will consider the very useful Max-to-Sum (MS) plot, able to tell us something about the existence of moments, and the Concentration Profile, another way of looking at tails, starting from the Gini index.
More about the Concentration Profile: https://papers.ssrn.com/sol3/papers.c...
Topics:
00:00 Introduction
04:12 The MS plot
21:36 The Concentration Profile

Доступные форматы для скачивания:
Скачать видео mp4
-
Информация по загрузке: