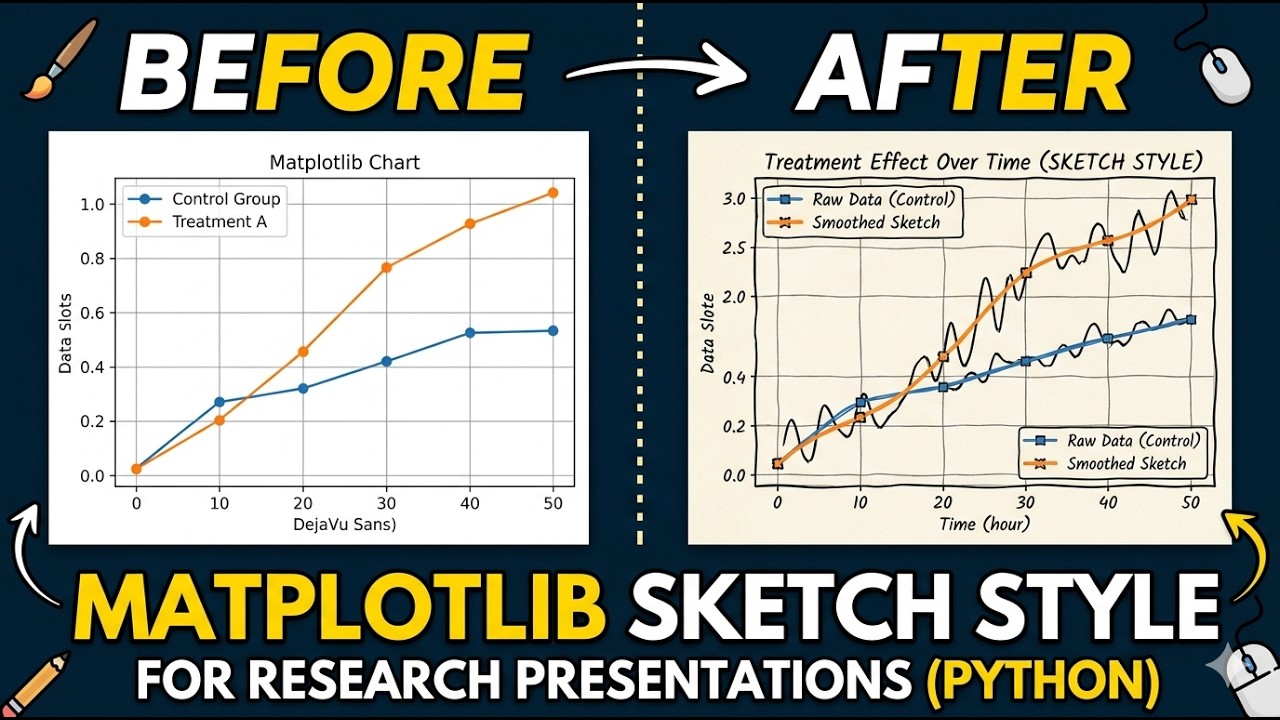
Matplotlib Sketch Style Plots for Research Presentation (Complete Python Guide)
Автор: Youven
Загружено: 2025-12-21
Просмотров: 24
Learn how to create stunning hand-drawn sketch style plots in Matplotlib that make your research figures stand out! This comprehensive tutorial shows you how to generate XKCD-style publication-ready visualizations in Python.
🎯 What You'll Learn:
• How to enable sketch style in Matplotlib
• Creating professional hand-drawn looking plots
• Customizing sketch parameters for different effects
• Best practices for publication-ready figures
• Real-world examples from research papers
💡 Perfect for researchers, data scientists, and anyone looking to create unique visualizations that grab attention in papers and presentations!
🔗 Related Videos:
Use Latex in Inkscpape the right way : • Create Batch Certificate Creation for Cour...
📱 Connect with me:
• Website: https://augmentedscholars.com/
• Substack: https://augmentedscholars.substack.co...
• LinkedIn: / rachid-youven-zeghlache
• GitHub: https://github.com/YouvenZ
#Matplotlib #Python #DataVisualization #Research #ScientificProgramming #DataScience #Plotting #XKCD
Доступные форматы для скачивания:
Скачать видео mp4
-
Информация по загрузке:


![OpenAI API for Research: Extract Data from Papers with Structured Outputs [Scalable & Reliable]](https://image.4k-video.ru/id-video/kbxSblwDMec)


