How Do You Create a Fish Scale Pattern Plot in Python Using Matplotlib?
Автор: PyPlus
Загружено: 2026-01-05
Просмотров: 1
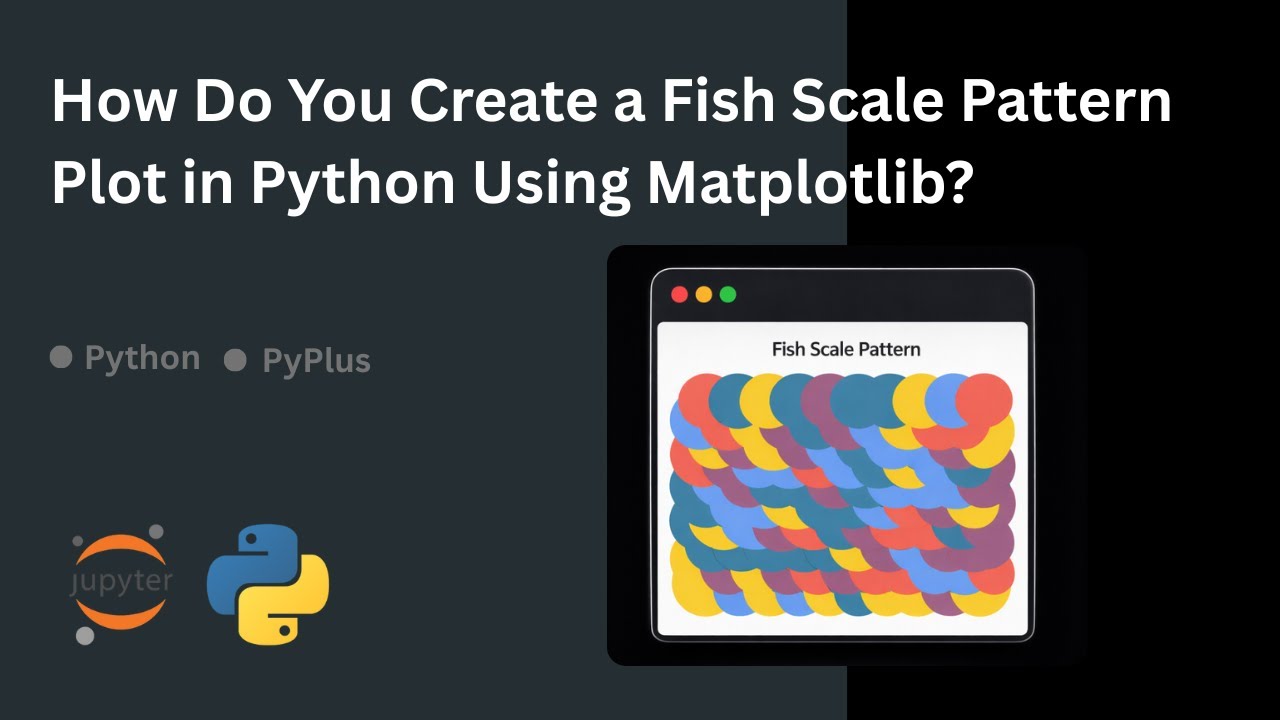
In this video, you’ll learn how to create a Fish Scale Pattern plot in Python using NumPy and Matplotlib.
Fish scale patterns are a popular example of creative coding and generative art, where simple geometric shapes are combined to produce visually appealing designs. In this tutorial, we use circles arranged in staggered rows to simulate a fish scale effect with colorful patterns.
What you’ll learn:
How to use NumPy for grid-based calculations
How to draw shapes using Matplotlib patches
How to create staggered rows for pattern design
How to apply random colors for creative visuals
How to build generative art using Python
This tutorial is ideal for:
Python beginners
Creative coding enthusiasts
Data visualization learners
Generative art and design projects
📌 Libraries used: NumPy, Matplotlib
🎨 Pattern type: Fish Scale / Generative Pattern
💻 Language: Python
If you enjoyed this video, like, share, and subscribe for more Python visualization tutorials
#Python
#Matplotlib
#NumPy
#FishScalePattern
#CreativeCoding
#GenerativeArt
#PythonVisualization
#PythonTutorial
#CodingArt
#LearnPython
Доступные форматы для скачивания:
Скачать видео mp4
-
Информация по загрузке: