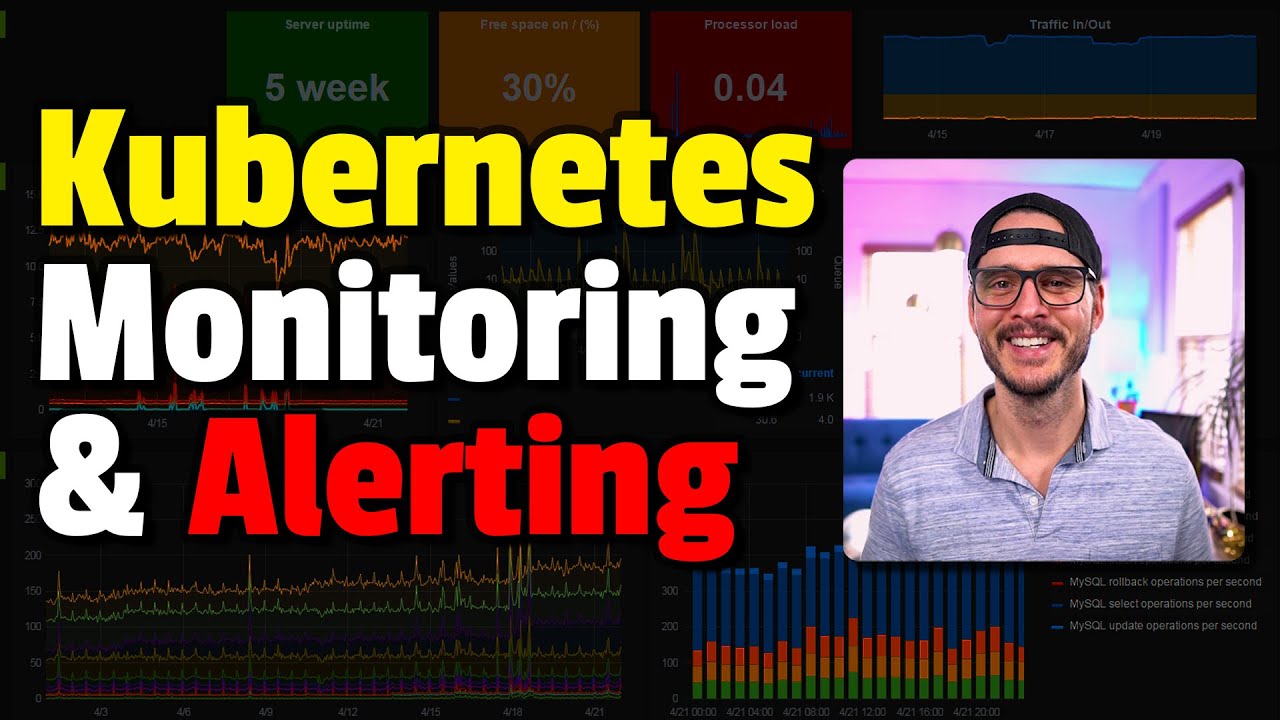
Monitoring Your Kubernetes Cluster with Grafana, Prometheus, and Alertmanager
Автор: Techno Tim
Загружено: 2021-04-10
Просмотров: 30662
Today in this step by step guide, we'll set up Grafana, Prometheus, and Alertmanager to monitor your Kubernetes cluster. This can be set up really quickly using helm or the Rancher UI. We'll install and configure, set up some dashboards, and even set up some alerts using Slack. All this and more in this simple to follow, easy tutorial. Setting up Grafana and Prometheus has never been so easy.
Video Notes: https://technotim.live/posts/rancher-...
Support me on Patreon: / technotim
Sponsor me on GitHub: https://github.com/sponsors/timothyst...
Subscribe on Twitch: / technotim
Become a YouTube member: / @technotim
Merch Shop: https://l.technotim.live/shop
Gear Recommendations: https://l.technotim.live/gear
Get Help in Our Discord Community: https://l.technotim.live/discord
2nd channel: / @technotimtalks
(Affiliate links may be included in this description. I may receive a small commission at no cost to you.)
00:00 - Why Use Grafana, Premetheus, and Alert Manager
01:07 - Setting up Monitoring and Alerting with Rancher
01:53 - How to Install
02:32 - It's really just a Helm install
03:29 - Install process
04:11 - Grafana is collecting metrics
04:30 - Setting up Receivers in Promethus
05:00 - Setting up Alerts for Slack
05:40 - Adding a Webhook
07:33 - Prometheus / Alertmanager Routes
08:34 - Prometheus Rules
09:08 - Check Alerts in Slack
10:01 - Tuning Alerts
10:31 - Back to Grafana Charts and Graphs
10:56 - Grafana Dashboards
12:19 - We get quite a bit for nothing
13:06 - Would you use this?
13:15 - Stream Highlight "Hardware, Software, Services, Interaction === ♥"
#Prometheus #Grafana #devops
"Retrodomus" is from Harris Heller's album Breaker.
https://l.technotim.live/sb-music-lic...
Thank you for watching!
Доступные форматы для скачивания:
Скачать видео mp4
-
Информация по загрузке:


![Kubernetes monitoring [08]. Alertmanager, Karma](https://imager.clipsaver.ru/ABRy8LBuzSs/max.jpg)


