Скачать
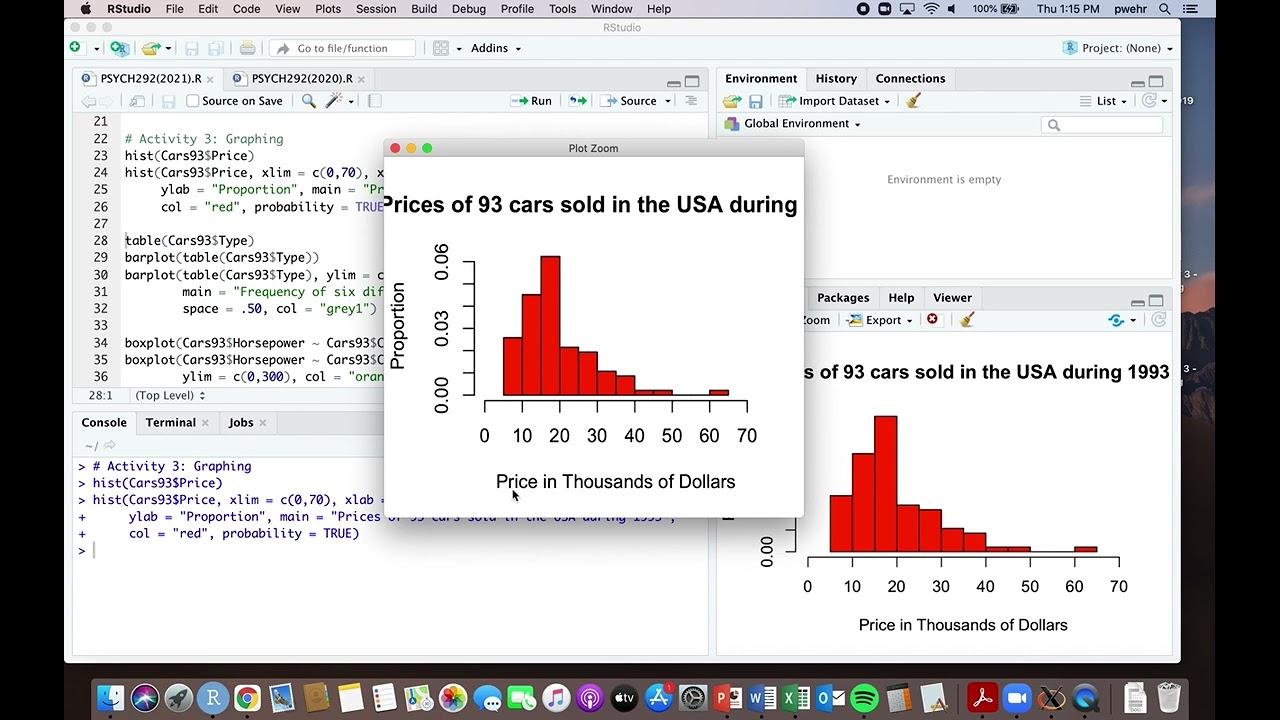
Creating histograms, bar graphs, and box plots using R
Автор: Dr. P
Загружено: 2025-09-23
Просмотров: 11
Описание:
This video was originally created for a statistics class in psychology at the University of Waterloo.
Доступные форматы для скачивания:
Скачать видео mp4
-
Информация по загрузке: