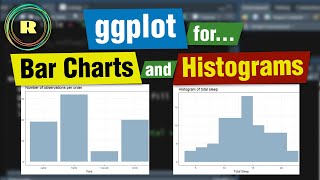
Creating a Density Histogram in R with ggplot2: Extracting Key Values
Автор: vlogize
Загружено: 2025-04-14
Просмотров: 1
Learn how to create a density histogram in R using ggplot2 and extract important density values and midpoints for each bin.
---
This video is based on the question https://stackoverflow.com/q/69228403/ asked by the user 'Farrokh Habibzadeh' ( https://stackoverflow.com/u/15689201/ ) and on the answer https://stackoverflow.com/a/69237585/ provided by the user 'Christopher Belanger' ( https://stackoverflow.com/u/16909607/ ) at 'Stack Overflow' website. Thanks to these great users and Stackexchange community for their contributions.
Visit these links for original content and any more details, such as alternate solutions, latest updates/developments on topic, comments, revision history etc. For example, the original title of the Question was: Density values of histogram in ggplot2?
Also, Content (except music) licensed under CC BY-SA https://meta.stackexchange.com/help/l...
The original Question post is licensed under the 'CC BY-SA 4.0' ( https://creativecommons.org/licenses/... ) license, and the original Answer post is licensed under the 'CC BY-SA 4.0' ( https://creativecommons.org/licenses/... ) license.
If anything seems off to you, please feel free to write me at vlogize [AT] gmail [DOT] com.
---
Understanding Density Histograms in ggplot2
When working with data visualization in R, creating effective histograms can often pose a challenge, especially when you want to display density values. The base R functions make this simple, but many users prefer the advanced graphics capabilities of ggplot2. This article will address how to create a density histogram using ggplot2 and how you can retrieve the density values and midpoints for each bin.
The Problem: Extracting Density Values from ggplot2
In base R, the function hist() can produce a histogram of a variable with the argument freq=FALSE, allowing users to obtain the density of bins easily. However, when it comes to ggplot2, users often wonder how to extract similar information regarding the bin midpoints and densities after creating their histograms. This guide will guide you through the process.
The Solution: Using ggplot2 to Create a Density Histogram
Creating a density histogram using ggplot2 is straightforward and can be achieved with just a few lines of code. Let's go through the process step-by-step using the built-in iris dataset as an example.
Step 1: Load Required Libraries
First, ensure that you have the ggplot2 library installed and loaded in your R environment. You can install it (if you haven't already) using the following command:
[[See Video to Reveal this Text or Code Snippet]]
Load the library:
[[See Video to Reveal this Text or Code Snippet]]
Step 2: Create Your Histogram
To create a density histogram, use geom_histogram(). Here’s how you can do it:
[[See Video to Reveal this Text or Code Snippet]]
Key Components:
geom_histogram(): This is the function that creates the histogram.
aes(x=Petal.Width): Defines the variable for which the histogram is created.
bins = 11: Specifies the number of bins you want.
Step 3: Extracting Density Values and Midpoints
To extract the bin midpoints and densities from the histogram, you can use the ggplot_build() function. This function allows you to tap into the internal structure of the ggplot object and retrieve necessary details:
[[See Video to Reveal this Text or Code Snippet]]
Explanation of Outputs:
vals$x: Gives you a vector of the midpoints for each bin.
vals$density: Provides the density value associated with each bin.
Conclusion
Creating a density histogram in ggplot2 not only enhances the visual appeal of your data but also allows for the extraction of essential bin information like midpoints and densities. This approach can be highly beneficial for further data analysis and presentation. By following the steps laid out in this post, you can efficiently gather critical insights from your histogram visualizations, thus taking your data analysis to the next level.
We hope this blog has clarified how to work with density histograms in ggplot2 and equipped you with the tools to extract valuable information for your datasets.

Доступные форматы для скачивания:
Скачать видео mp4
-
Информация по загрузке: