Скачать
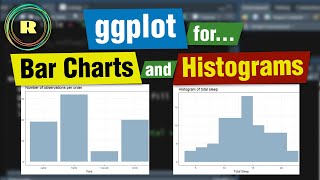
Bar and Column Graphs in R (using ggplot2)
Автор: Peeling Back Data
Загружено: Aug 23, 2020
Просмотров: 10,241 views
Описание:
This is the second lecture in the course 'Graphical and Visual Analysis in R' and guides you how to perform basic and complex bar charts in R using ggplot2. The time stamps for each section are:
00:00 Introduction and Basic Bar Plot
02:36 General Bar Plot
05:12 Geom_col, and how it’s very similar to geom_bar()
07:33 Tweaking your bar plot
11:15 Adding Error Bars (geom_errorbar)

Доступные форматы для скачивания:
Скачать видео mp4
-
Информация по загрузке: