Скачать
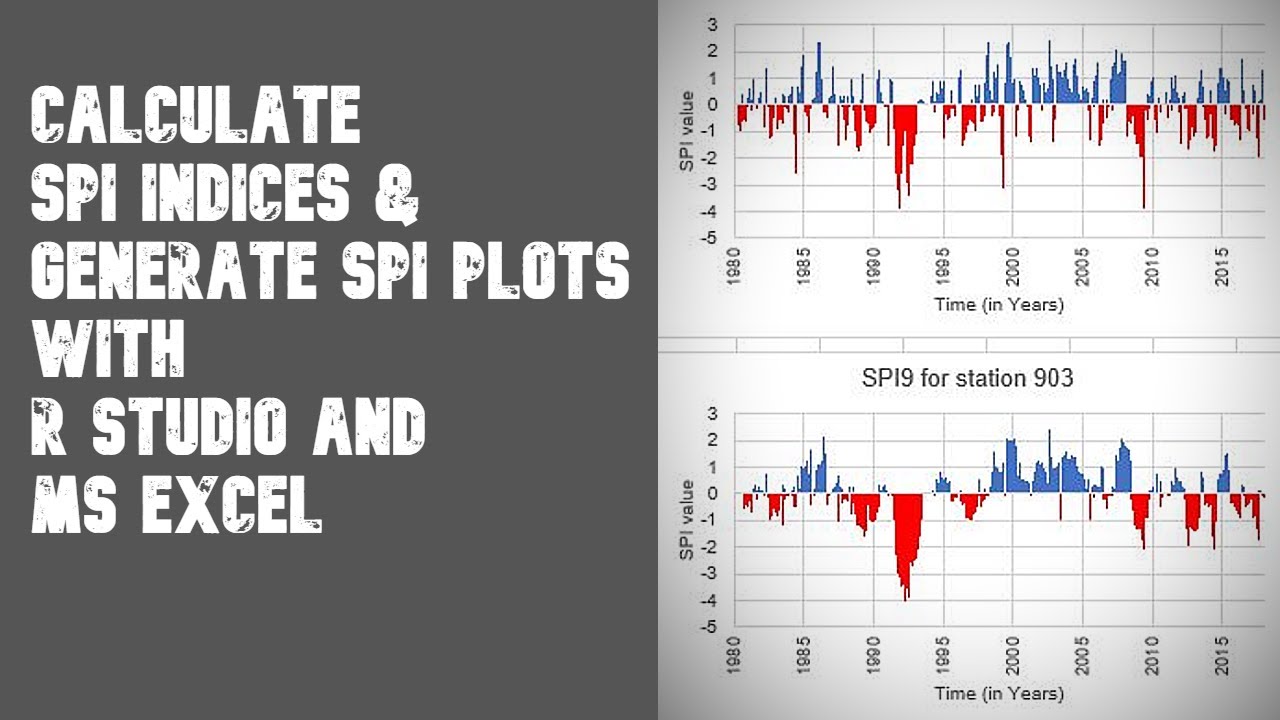
Calculating SPI index using R studio | Video Tutorial
Автор: Red Fish
Загружено: 2020-10-12
Просмотров: 26114
Описание:
Hello Guys,
In this video I will guide you through the R studio interface on how to determine the SPI index from precipitation data.
The links for my excel file: https://drive.google.com/file/d/1m8v5...
The link to video on How to install R studio:
Hope you found this useful :D
Доступные форматы для скачивания:
Скачать видео mp4
-
Информация по загрузке: