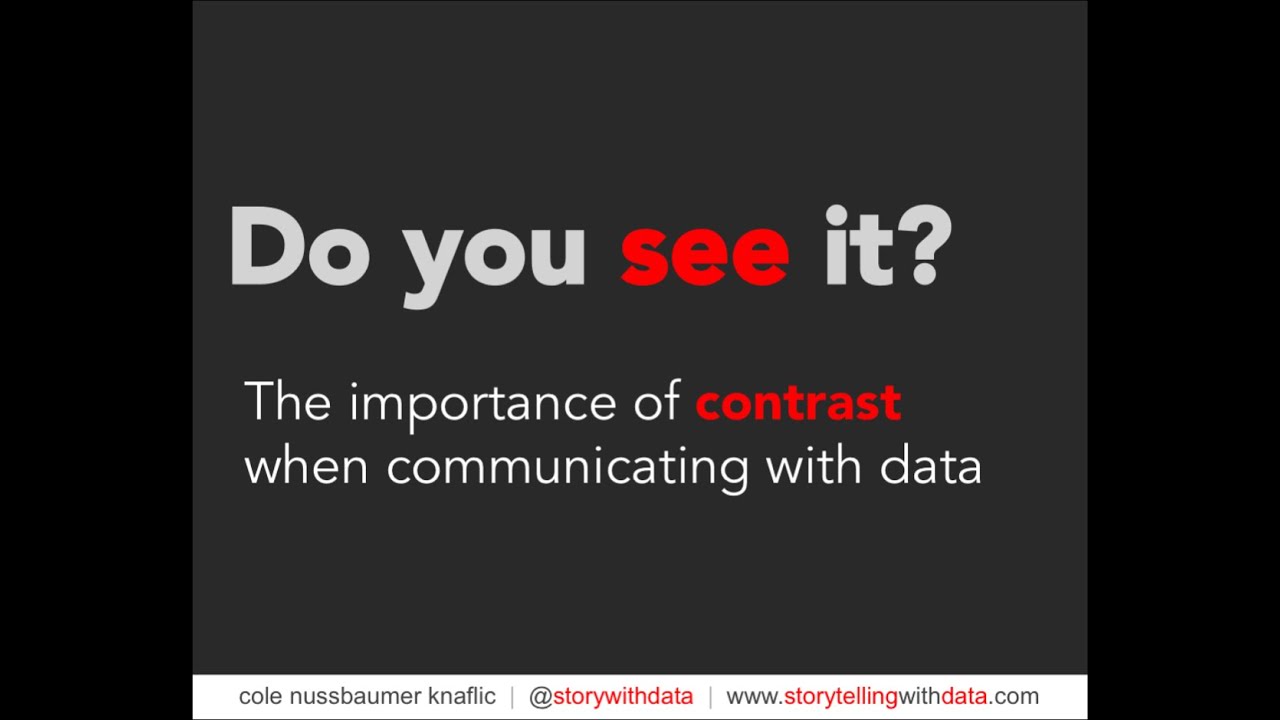
The importance of contrast when communicating with data.
Автор: storytelling with data
Загружено: 2016-09-21
Просмотров: 21658
It's easy to create a graph. But how do you visualize data in a way that leads your audience to see what you want them to see? One way is through thoughtful use of contrast. In this video, Cole Nussbaumer Knaflic discusses the power of visual contrast, demonstrates strategies for achieving it via position, color, and added marks, and applies the lessons to four real-world examples.
TIMELINE
00:00 Intro
02:30 It’s easy to spot a Hawk in a sky full of pigeons
03:26 No clear contrast? No idea where to look
04:20 A quick lesson on visual perception
05:38 An exercise on pre attentive processing
06:28 Pre attentive attributes
09:09 4 examples to achieve visual contrast with position, color & added & marks
09:40 Learning by example 1: weighted performance index
14:44 Learning by example 2: main source of news
21:23 Learning by example 3: distribution by customer segment
24:34 Learning by example 4: marriage rate by education
28:20 Outro
BONUS RESOURCES
● Practice highlighting the important stuff: https://community.storytellingwithdat...
● Use contrast to make the story unmistakable: https://community.storytellingwithdat...
● Watch how to emphasize an insight (available to premium only): https://community.storytellingwithdat...
● Read about other chart makeovers: https://www.storytellingwithdata.com/...
IMPROVE YOUR DATA VISUALIZATION & STORYTELLING SKILLS
INTRODUCING OUR NEW BOOK - AVAILABLE TO PREORDER
📚 STORYTELLING WITH DATA: BEFORE & AFTER
Packed with real-world makeovers and practical strategies, through twenty powerful transformations, watch ineffective charts evolve into engaging visuals that captivate, inform, and lead to smarter decisions—preorder now! https://amzn.to/3QNJtyV
STAY CONNECTED
👉 Sign up for our newsletter to be notified about new content and offerings. https://storytellingwithdata.com/news...
#datavisualization #datastorytelling
Доступные форматы для скачивания:
Скачать видео mp4
-
Информация по загрузке: