Module 57 - Infographic Designer
Автор: Desktop Data Crunching
Загружено: 2017-06-30
Просмотров: 3762
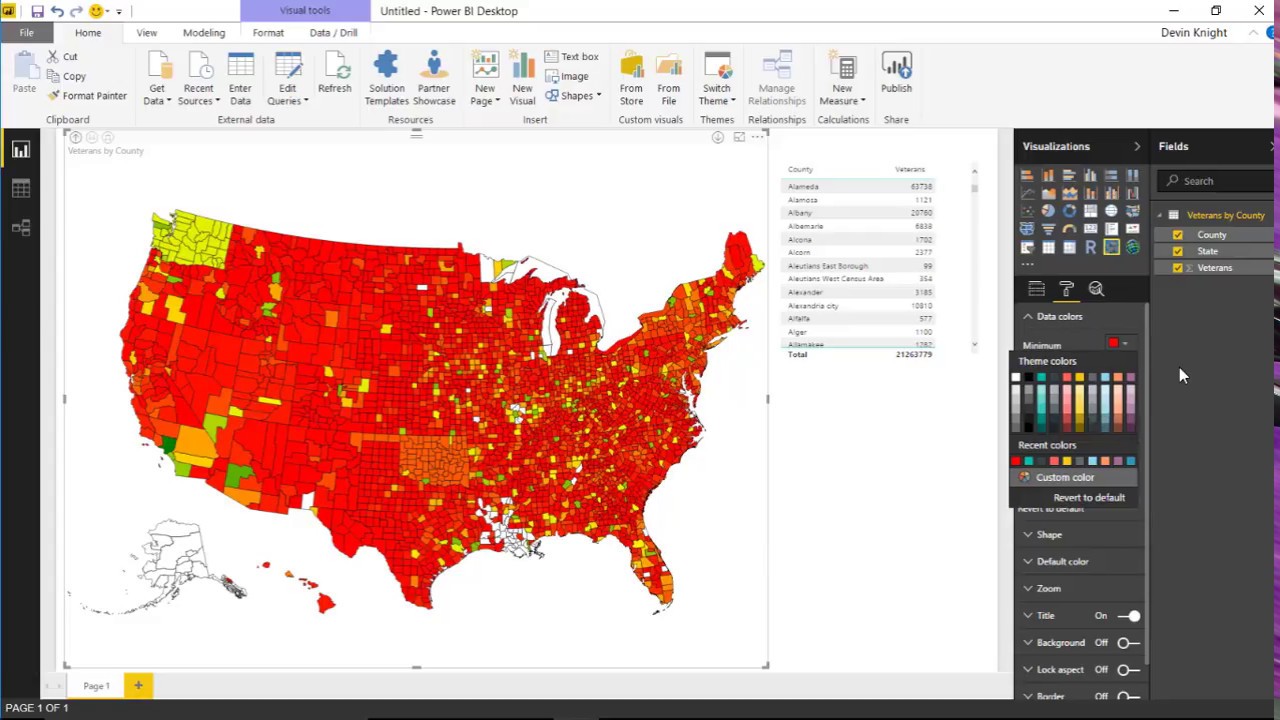
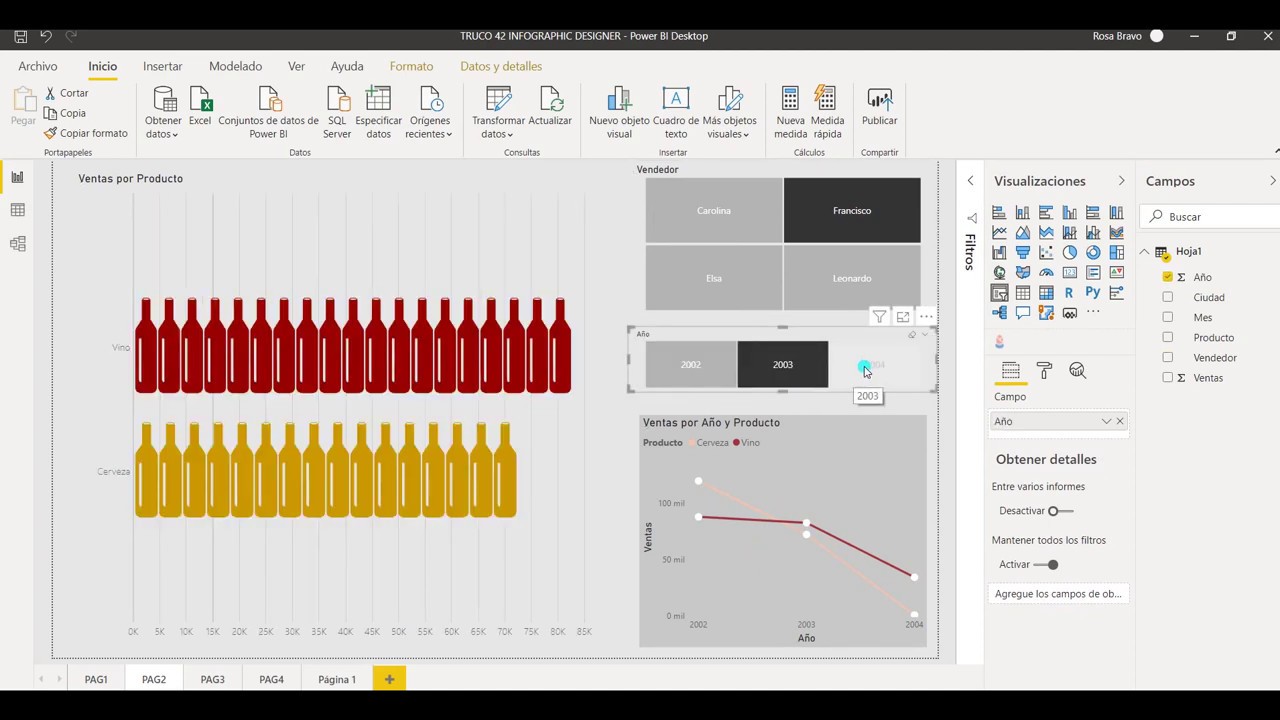
In this module you will learn how to use the Infographic Designer Custom Visual. The Infographic Designer give you the ability to make your reports tell a story and even theme the visuals to be more relevant to the topic of your data.
Downloads:
Social Media Users - Infographic.xlsx
(https://file.ac/zMH510mp574/Social%20...)
Blog Summary:
https://devinknightsql.com/2017/06/30...
Completed Example:
https://file.ac/NNCnsq7iQug/Module%20...
Custom Visual:
https://file.ac/igkZ26qGB04/infograph...
SVG Shape Files:
https://file.ac/I2Q8h2wkV3k/facebook.svg
https://file.ac/1pUHqMWZ6Sw/twitter.svg
https://file.ac/tWUBdBwlJ7s/linkedin.svg
https://file.ac/-Lz4zLZ2QhM/youtube.svg
View this class in full and other Power BI training by subscribing to the Pragmatic Works On Demand Training. http://pragmaticworks.com/Training/On...

Доступные форматы для скачивания:
Скачать видео mp4
-
Информация по загрузке: