Скачать
Mapping with ggplot
Автор: R for the Rest of Us
Загружено: 2025-08-18
Просмотров: 316
Описание:
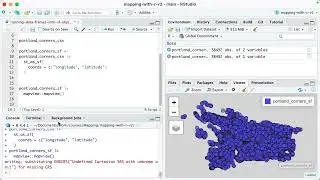
Learn how to create static maps in R using {ggplot2} and {sf}. This lesson walks through mapping U.S. counties by percent of non-English speakers and includes tips like shifting geometries for better map readability.
This is a sample lesson from the Mapping with R course. To see the full course, go to: rfortherestofus.com/mapping

Доступные форматы для скачивания:
Скачать видео mp4
-
Информация по загрузке: