Скачать
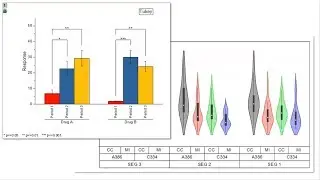
Add Reference Lines to graph axes based on statistics and expressions
Автор: OriginLab Corp.
Загружено: 2017-11-15
Просмотров: 63054
Описание:
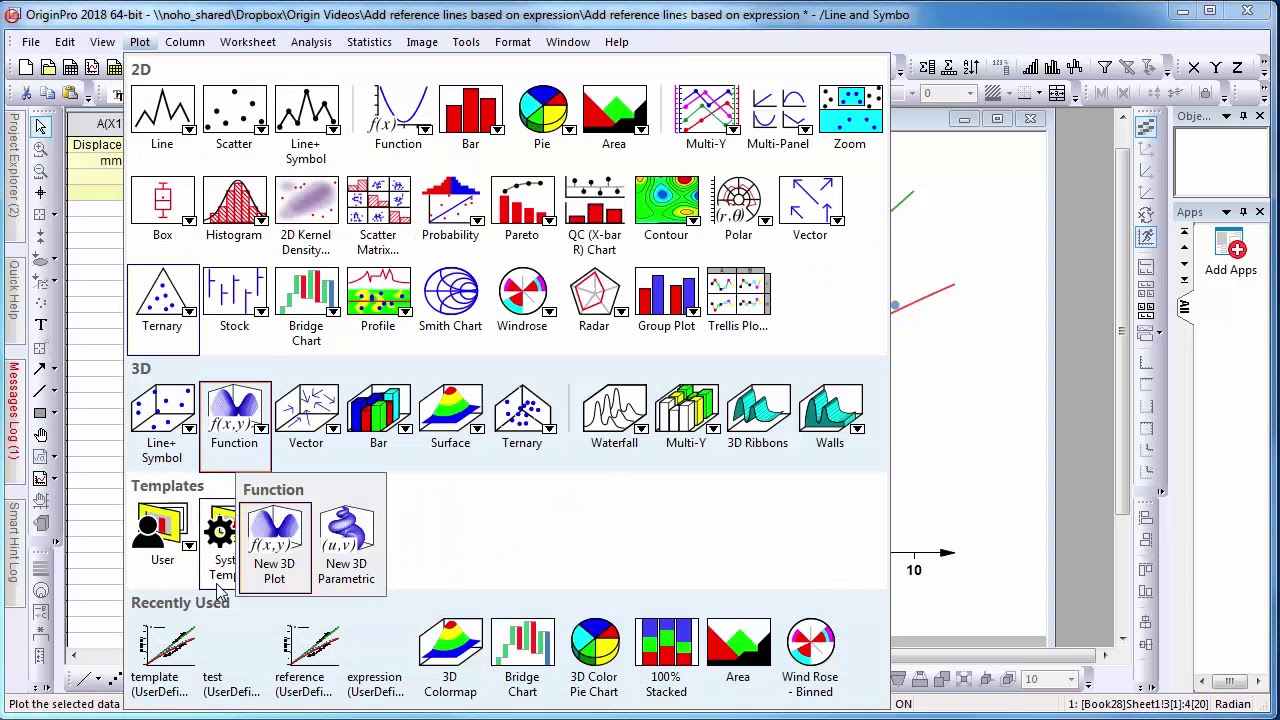
In Origin 2018 one can add reference lines to the graph axes by using statistical functions such as mean and standard deviation and can as well use custom equations or expressions to add lines based on axis scale values. The line can then be saved in a graph template for repeated use and be updated when the data changes.
Доступные форматы для скачивания:
Скачать видео mp4
-
Информация по загрузке: