Скачать
Data Visualization in Matlab / Octave [Part 2]
Автор: Engr. Sheraz Ali Khan Mechatronics
Загружено: 2020-07-27
Просмотров: 140
Описание:
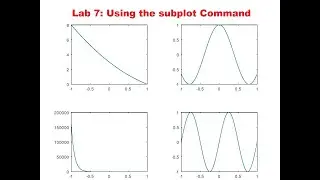
This is the second part of the two videos on data visualization in Matlab / Octave. It discusses how to use the plot and hist functions. This is for our 6th session of Introduction to Computing Lab on 27 July 2020.
![Data Visualization in Matlab / Octave [Part 2]](https://i.ytimg.com/vi/7Fd_8SYo_AM/maxresdefault.jpg)
Доступные форматы для скачивания:
Скачать видео mp4
-
Информация по загрузке:


![Как сжимаются изображения? [46 МБ ↘↘ 4,07 МБ] JPEG в деталях](https://image.4k-video.ru/id-video/Kv1Hiv3ox8I)


