Who Dominated Cinnamon Production? | Global Producing Ranking 1961–2026
Автор: World In Data
Загружено: 2026-01-15
Просмотров: 20
Who Dominated Cinnamon Production? | Global Producing Ranking 1961–2026
✅ Other interesting data comparisons : • Best Data Comparisons
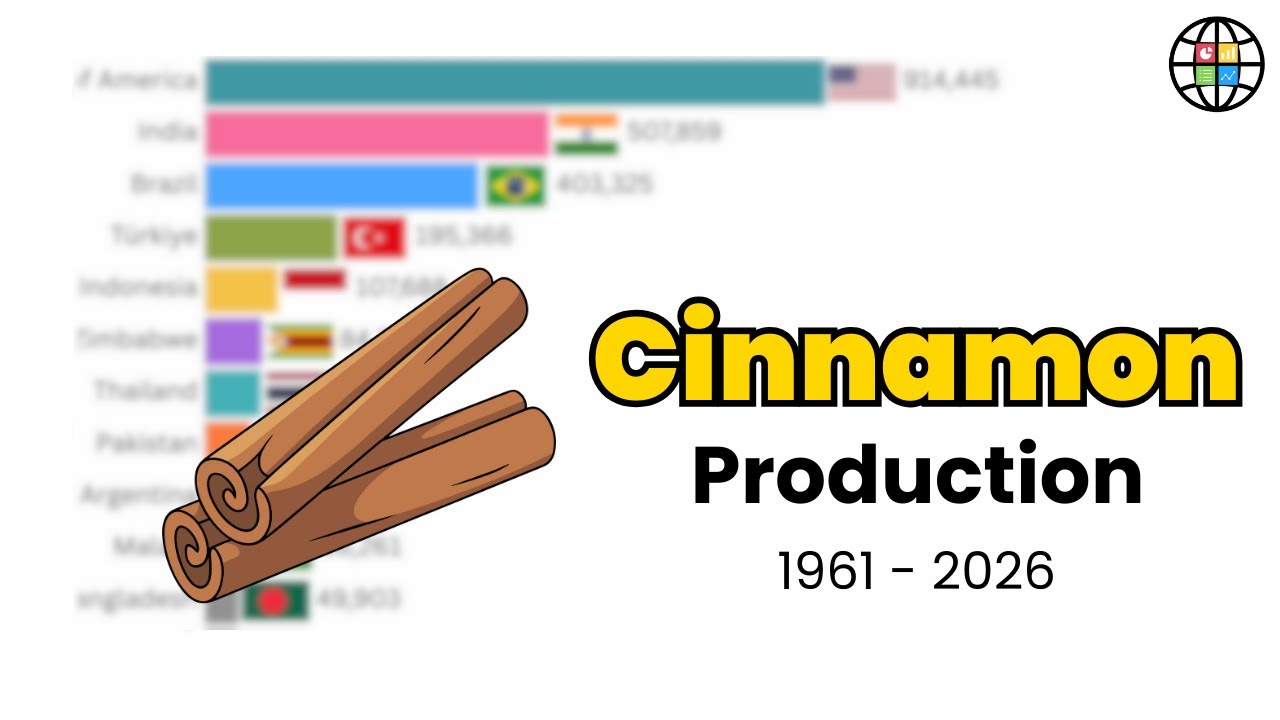
Cinnamon production is highly concentrated and sensitive to climate and labor. This bar chart race tracks cinnamon production by country, revealing dominance, supply risks, and long-term trends. Used in food, medicine, and cosmetics, cinnamon demand keeps growing while production remains fragile. See how exporters rise, stabilize, or lose ground in this global spice market.
TIME STAMP (~7m)
0:00 Cinnamon market overview
0:50 Early dominance
1:45 Production concentration
2:50 Supply pressure phase
4:00 Export-driven shifts
5:20 Modern leaders
6:30 Final outcome
#cinnamon #spices #agriculture
#datavisualization #barchartrace #worlddata
#chartracedata #dataanalysis #datacomparison
Sources :
FAO
Disclaimer – World In Data
All visualizations, datasets, and analyses presented by World In Data has been cross-verified, normalized, and interpolated using transparent and scientifically rigorous methods to ensure internal consistency across time and geography. While every effort has been made to maintain accuracy, some figures — especially for earlier historical periods or projections — represent best-estimate reconstructions derived from multiple reputable sources. But these data may be modeled estimates and subject to distortion
Доступные форматы для скачивания:
Скачать видео mp4
-
Информация по загрузке:


