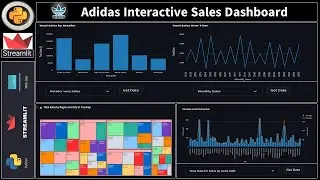
Python Interactive Dashboard Development using Streamlit and Plotly
Автор: Programming Is Fun
Загружено: 2023-06-20
Просмотров: 266611
In this video you will learn step by step Python Interactive Dashboard Development using Streamlit and Plotly just like PowerBI and Tableau etc.
Streamlit is a popular Python library used for building interactive web applications and dashboards. It simplifies the process of creating data-driven applications by providing a straightforward and intuitive interface. Here are some key uses of Streamlit in Python dashboards
Rapid Prototyping:
Data Visualization:
User Interaction:
Integration with Machine Learning Models:
Sharing and Deployment:
⭐Content⭐
In this video, you will learn: ⚡
1.) Utilizing Streamlit to create interactive plots
2.) Navigating and uploading raw data into the dashboard
3.) Creating titles, headings, headers, or subheaders in Streamlit
4.) Generating segments for plots within Streamlit
5.) Adding a date picker to the dashboard
6.) Handling and transforming data using Python Pandas with Streamlit
7.) Creating a side pane with multiple select filters
8.) Transforming data using Pandas
9.) Visualizing data using Python Plotly and plotting all graphs within the Streamlit environment
10.) Performing Time Series Analysis in Streamlit
11.) Downloading or viewing data based on plots
12.) Creating a hierarchical view of sales using TreeMap
13.) Creating data tables using Plotly Figure_Factory
14.) Applying styles to data within Streamlit
15.) Viewing or downloading data using Streamlit
16.) Performing Data Analysis and Data Visualization using Python Streamlit
17.) Examples...
Overall, Streamlit simplifies the process of creating interactive Python dashboards by providing an intuitive interface, data visualization capabilities, user interaction features, and easy deployment options. It is a powerful tool for data scientists, developers, and anyone looking to showcase data and insights in an engaging and accessible manner.
Pandas and Plotly are powerful libraries that play essential roles in dashboard development.
➖➖➖➖➖➖➖➖ ➖➖➖➖➖➖➖➖
👍 Pandas:
1.) Data Manipulation
2.) Data Cleaning and Preprocessing
3.) Data Integration
4.) Data Transformation
👍 Plotly:
1.) Interactive Data Visualization
2.) Dynamic Updating
3.) Intuitive Interactivity
4.) Dash Integration
In summary, Pandas and Plotly complement each other in dashboard development. Pandas helps with data manipulation, cleaning, and preprocessing, while Plotly enables interactive and visually appealing data visualizations. Together, they empower you to build powerful and insightful dashboards that effectively present and analyze data.
➖➖➖➖➖➖➖➖➖➖➖➖➖➖➖➖
Interactive Web Portfolio using Python Streamlit : • Building a Professional Web Portfolio with...
Raw Data Set : https://community.tableau.com/s/quest...
Streamlit Emoji Icons: https://streamlit-emoji-shortcodes-st...
Python Streamlit Dashboard Source Code: https://github.com/AbhisheakSaraswat/...
Python Pandas Tutorial: • Python Pandas Tutorial | What is Pandas | ...
Python Playlist: • Python Tutorial for Beginners
Python Data Structure Playlist: • Python Data Structure
Python OOPs Playlist: • Object Oriented Programming Tutorials Usin...
Telegram Link: https://t.me/+32-TodtiOvo2Njk9
➖➖➖➖➖➖➖➖ or ➖➖➖➖➖➖➖➖
👍 Subscribe Now: https://bit.ly/41B5ep2
➖➖➖➖➖➖➖➖➖➖➖➖➖➖➖➖➖
#python
#programming
#datascience
#machinelearning
#webdevelopment
#code
#developer
#softwareengineering
#opensource
#tutorial
#tech
#coding
#computerprogramming
#pandas
#numpy
#matplotlib
#StreamlitTutorial
#PythonDashboard
#InteractivePlots
#DataVisualization
#StreamlitAndPlotly
#DataAnalysis
#TimeSeriesAnalysis
#PandasTutorial
#PlotlyVisualization
#DataTables
#DashboardDevelopment
#PythonProgramming
#StreamlitExamples
#DataManipulation
#DataFiltering
#DataTransformation
#HierarchicalView
#DataExploration
#DashboardDesign
#StreamlitTips

Доступные форматы для скачивания:
Скачать видео mp4
-
Информация по загрузке: