Скачать
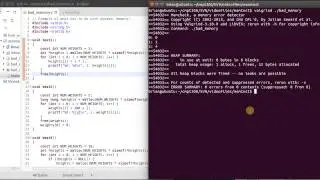
Using Valgrind and GDB together to fix a segfault and memory leak
Автор: Mike Shah
Загружено: 2021-04-25
Просмотров: 38067
Описание:
►GDB Beginner Masterclass: • GDB Beginner Masterclass
►Find full courses on: https://courses.mshah.io/
►Join as member to get perks: / @mikeshah
►Lesson Description: In this lesson I show you how to use Valgrind and GDB together to find bugs. This is a nice review of some of the tools that we have learned, and a reminder that you can combine as many of the tools that we learn together in order to help debug!
►Please like and subscribe to help the channel!
►YouTube Channel: / mikeshah
►Join our free community: https://courses.mshah.io/communities/...

Доступные форматы для скачивания:
Скачать видео mp4
-
Информация по загрузке: