Скачать
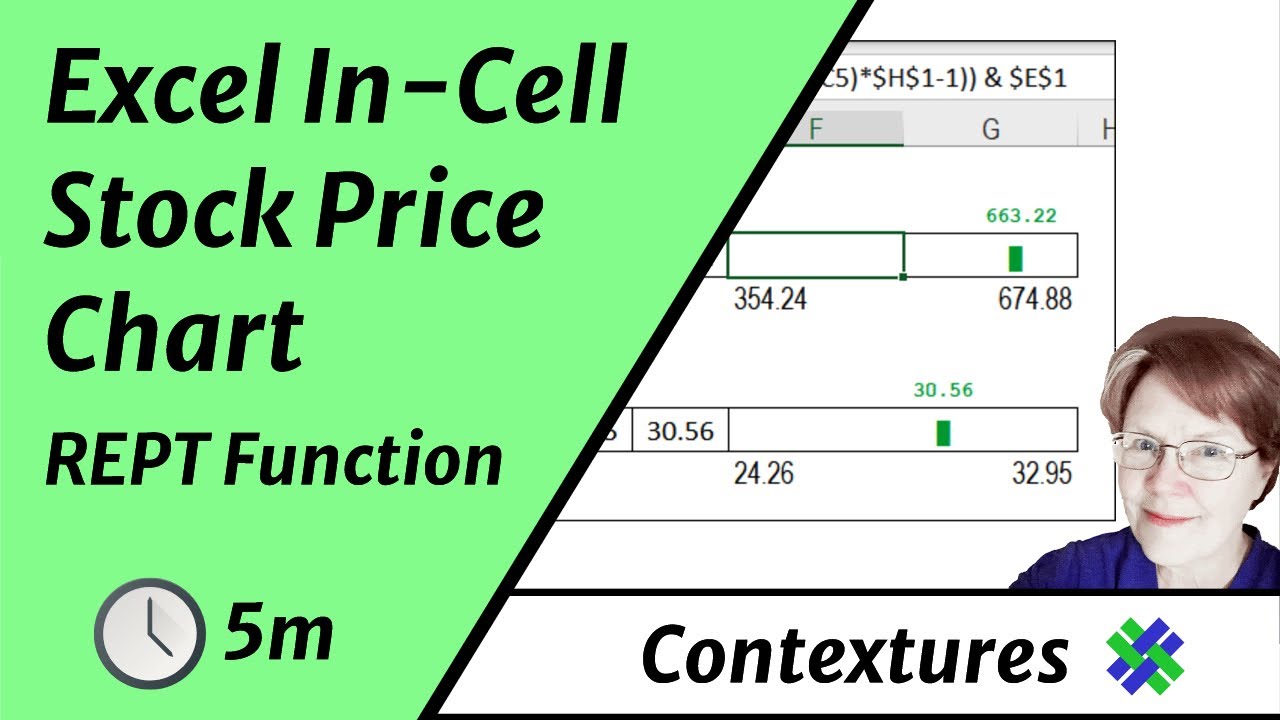
Show Stock Price With In-Cell Dot Plot Chart in Excel
Автор: Contextures Inc.
Загружено: 2012-09-17
Просмотров: 3629
Описание:
With Excel's REPT function, you can create an in-cell chart that shows a marker for the current stock price, compared to the low and high prices for that stock.
Watch this video to see how to set up the formula, and format the in-cell chart.
Visit this page to download the sample file, and for written instructions.
https://contexturesblog.com/archives/...
Доступные форматы для скачивания:
Скачать видео mp4
-
Информация по загрузке: