Скачать
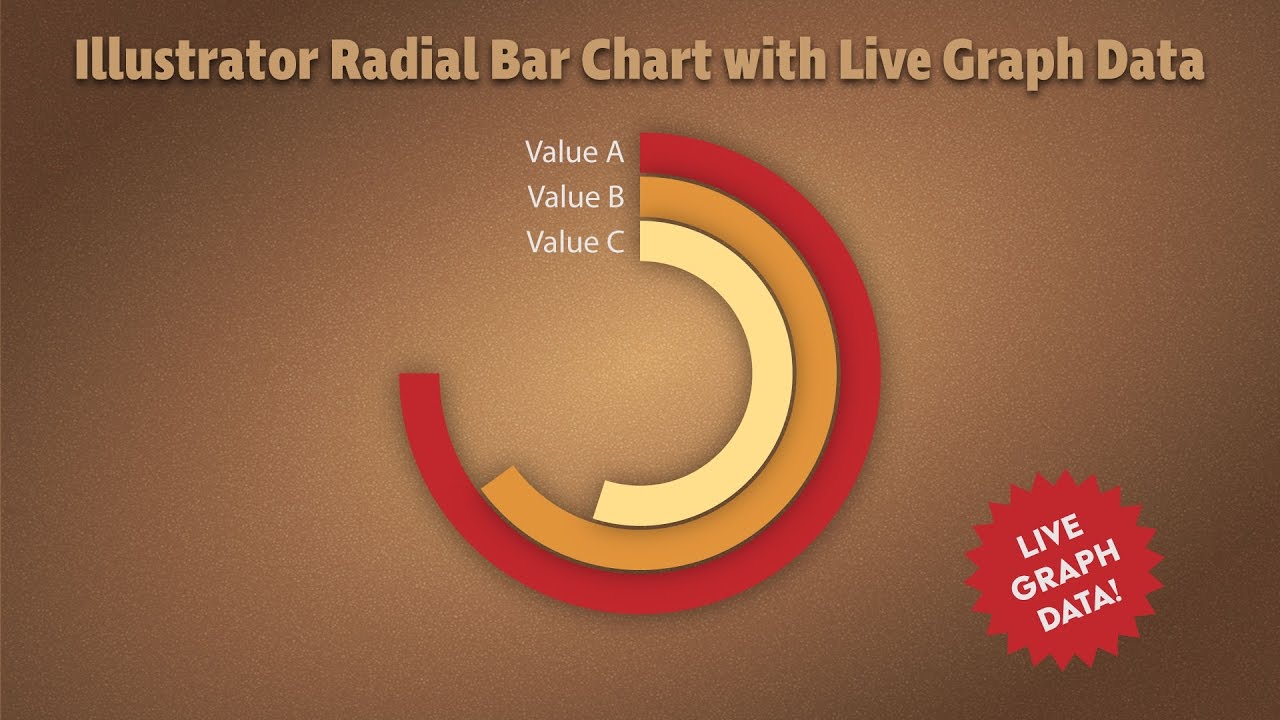
Make a Radial Bar Graph in Adobe Illustrator keeping data live
Автор: DN:TV The Design Ninja
Загружено: 2017-01-11
Просмотров: 155367
Описание:
Continuing on from the movie on making a doughnut chart, this movie shows how to make a radial bar graph in Illustrator.
Illustrator has some great graph tools but as they were conceived quite a way back they often "need a little help" especially with presenting data in more modern ways. This movie shows how to make a radial bar chart and keep the data live.
Note: at around 6:06, when I'm describing the size difference between the polar grid and the chart, I'm actually referring to the way that the chart is drawn, not the grid.
Доступные форматы для скачивания:
Скачать видео mp4
-
Информация по загрузке:


![How to make a pie chart, line graph & bar graph - Illustrator Advanced Training [41/53]](https://imager.clipsaver.ru/-ZvtEUz1gf8/max.jpg)