Experiment-9 | Data Visualization Laboratory BAI504 | Sales Revenue Analysis & Dashboard | VTU
Автор: ZAINAB TECH LAB
Загружено: 2026-01-13
Просмотров: 136
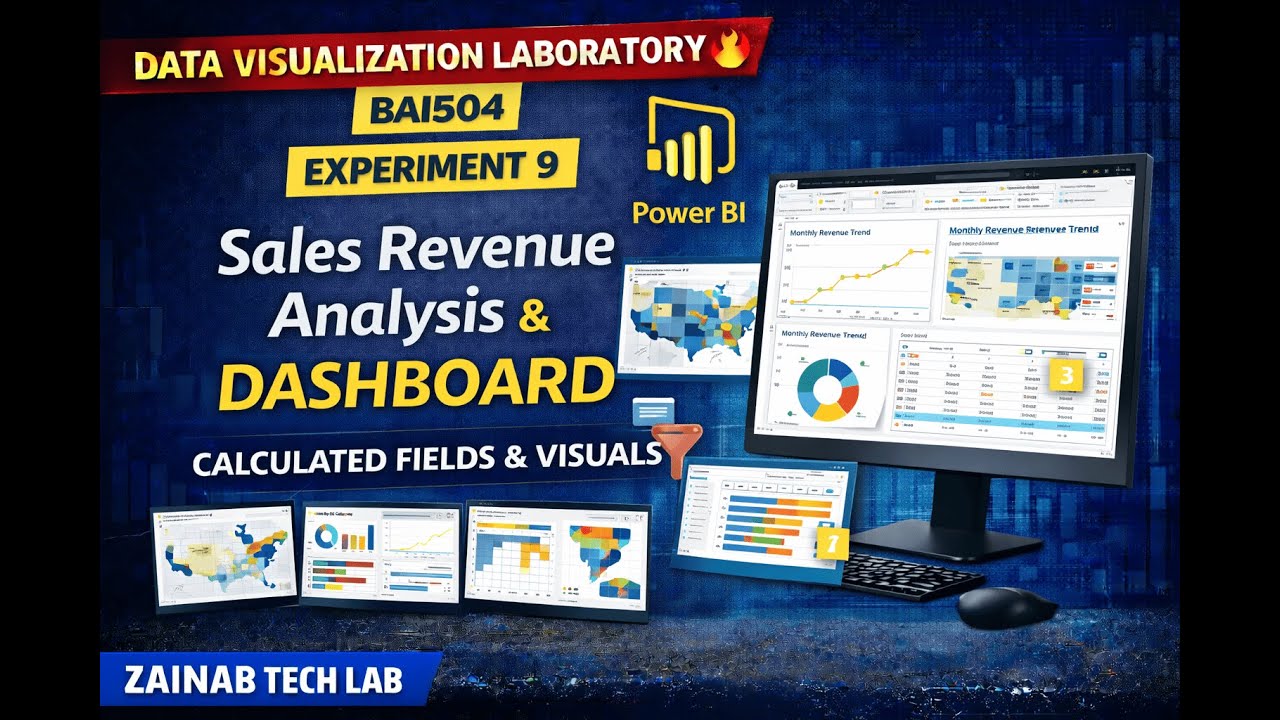
In this video, we cover Experiment-9 of Data Visualization Laboratory (BAI504):
Analysis of Revenue in Sales Dataset and Building Advanced Visualizations & Dashboard.
This experiment focuses on performing complete sales data analysis using different visualizations and calculated fields, and finally building an interactive dashboard, which is very important for VTU lab exams and viva.
Tasks Performed in Experiment-9:
Analysis of revenue in the sales dataset
Create a choropleth map to identify the state with the highest revenue
Create a line chart to show revenue based on month of the year
Create a bin of size 10 for age to analyze revenue
Create a donut chart to show percentage of revenue per region using zero axis
Create a butterfly chart to compare male & female revenue by product category
Create a calculated field to show average revenue per state and identify profitable & non-profitable states
Build an interactive dashboard
This experiment helps in understanding advanced data visualization techniques, calculated fields, and dashboard design, which are crucial for VTU practical exams.
Subject Name: Data Visualization Laboratory
Subject Code: BAI504
University: VTU
#BAI504 #VTULab
#DataVisualizationLaboratory
#Experiment9
#PowerBI
#SalesAnalysis
#Dashboard
#VTUPractical
#ZainabTechLab
Доступные форматы для скачивания:
Скачать видео mp4
-
Информация по загрузке: