Create Heatmap in R | AI Data Analysis Full Course (Batch 95)
Автор: Data Analysis &Visualization: R & Python Tutorials
Загружено: 2025-08-26
Просмотров: 87
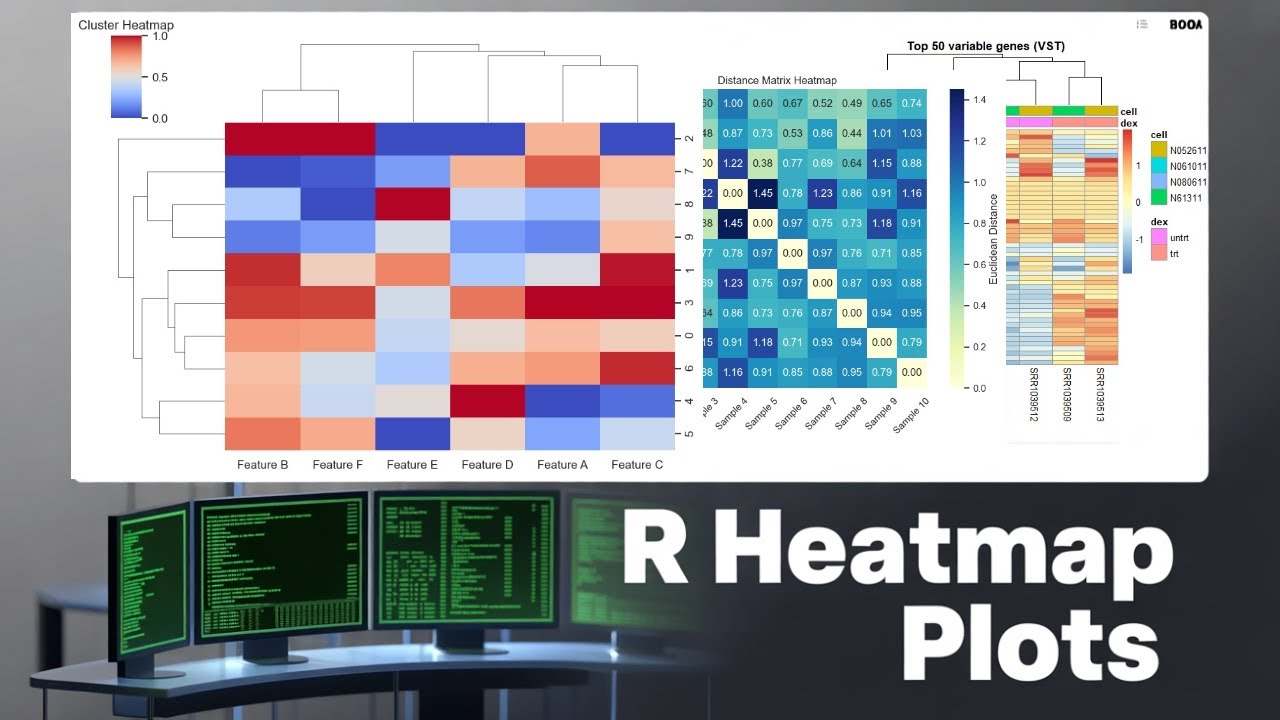
Master how to create a publication-ready heatmap in R using an AI-assisted workflow. This Batch 95 session from the Data Analysis in R Full Course covers data prep, scaling, clustering, color palettes, annotations, and exporting high-resolution figures for theses, papers, and reports. Perfect for MPhil/PhD/Postdoc researchers and data professionals.
What you’ll learn
Clean & scale data for heatmaps
Choose palettes (viridis/RColorBrewer) & breaks
Add row/column clustering & dendrograms
Annotate groups (e.g., treatment, province, clusters)
Export HD images (PNG/PDF, 300–600 DPI)
Tips to automate with AI for speed & accuracy
Tools & packages: ggplot2, pheatmap / ComplexHeatmap, dplyr, tidyr
Subscribe for more AI + R lessons from our Full Course (Batch 95).
Related Keywords / Tags (paste into VidIQ)
heatmap in R, R heatmap tutorial, publication ready heatmap R, ComplexHeatmap R, pheatmap R, AI data analysis in R, Batch 95 R course, R data visualization, hierarchical clustering R, R for researchers, thesis figures in R, ggplot heatmap, data analysis full course, R tutorial 2025, machine learning in R, annotated heatmap R
Hashtags
#R #Heatmap #DataAnalysis #AI #RProgramming #Batch95 #RVisualization #ResearchSkills
Доступные форматы для скачивания:
Скачать видео mp4
-
Информация по загрузке:


