Популярное

Музыка Кино и Анимация Автомобили Животные Спорт Путешествия Игры Юмор

Интересные видео

2025 Сериалы Трейлеры Новости Как сделать Видеоуроки Diy своими руками

Топ запросов

смотреть а4 schoolboy runaway турецкий сериал смотреть мультфильмы эдисон
dTub
Скачать

How To Create A Gantt Chart With A Progress Bar To Show Percentage Completion Of Tasks In Excel

Автор: The Excel Hub

Загружено: 2021-11-01

Просмотров: 389723

Описание:

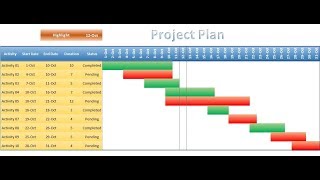
A Gantt chart is a bar chart which is used to illustrate tasks that are to be completed over time in a project. To create our Gantt chart, the first step is to set up a project table with a list of tasks to be completed and their start and end dates. The next step is to calculate the duration of each task which is the end date minus the start date. Later on, we will use the start date and duration columns to create our Gantt chart. We can also include the progress towards achieving each task and use this to identify how many days of each task have been completed. To create our Gantt chart, we will insert a stacked bar chart. We will use error bars, data labels and other techniques to make the bar chart look like a Gantt chart which will give us a clear overview of the tasks that must be completed and how much progress has been made so far.

Access the templates featured in The Excel Hub's video tutorials here:
https://theexcelhub.myshopify.com/

Subscribe for weekly Excel tutorials, techniques and examples:
   / @theexcelhub  

Please share this video with others that may find it useful:
   • How To Create A Gantt Chart With A Progres...  

Please comment below if you have any feedback or any suggestions for videos you would like us to upload next!

🌍 The Excel Hub website: https://theexcelhub.com/
📸 Instagram:   / theexcelhub  

ABOUT US:
The Excel Hub seeks to enhance your Excel and VBA knowledge by providing value-adding tutorials, techniques and examples in order to help you take your spreadsheet and data analysis skills to the next level.

For any enquiries, please contact:
[email protected]

Overview: (0:00)
Set Up Project Table: (0:23)
Create Gantt Chart: (1:32)

How To Create A Gantt Chart With A Progress Bar To Show Percentage Completion Of Tasks In Excel

Поделиться в:

Доступные форматы для скачивания:

Скачать видео mp4

  • Информация по загрузке:

Скачать аудио mp3

Похожие видео

Создайте эту потрясающую диаграмму Ганта в Excel (для управления проектами)

Создайте эту потрясающую диаграмму Ганта в Excel (для управления проектами)

Project Plan(Gantt Chart) in excel

Project Plan(Gantt Chart) in excel

How to Create Excel and PowerPoint Templates

How to Create Excel and PowerPoint Templates

Как создать динамическую диаграмму с помощью полосы прокрутки в Excel

Как создать динамическую диаграмму с помощью полосы прокрутки в Excel

Как создать ЛУЧШУЮ диаграмму Ганта в Excel (похоже на Microsoft Project!)

Как создать ЛУЧШУЮ диаграмму Ганта в Excel (похоже на Microsoft Project!)

Progress Bar in Excel Cells using Conditional Formatting

Progress Bar in Excel Cells using Conditional Formatting

Excel Tutorials

Excel Tutorials

TECH-005 - Создаём простую диаграмму Ганта (Time Line) в Exel

TECH-005 - Создаём простую диаграмму Ганта (Time Line) в Exel

📊 Как создать диаграмму Ганта в Excel | Пошаговое руководство 🧩 Идеально для управления проектами 🚀

📊 Как создать диаграмму Ганта в Excel | Пошаговое руководство 🧩 Идеально для управления проектами 🚀

Чем ОПАСЕН МАХ? Разбор приложения специалистом по кибер безопасности

Чем ОПАСЕН МАХ? Разбор приложения специалистом по кибер безопасности

How to Use VLOOKUP in Excel (free file included)

How to Use VLOOKUP in Excel (free file included)

НОВЫЕ ПРАВА И СТС 2026: новый РАЗВОД ДПС, 55 000 000₽ за ржавчину, новые ловушки и знаки ПДД

НОВЫЕ ПРАВА И СТС 2026: новый РАЗВОД ДПС, 55 000 000₽ за ржавчину, новые ловушки и знаки ПДД

Задача из вступительных Стэнфорда

Задача из вступительных Стэнфорда

Как создать диаграмму Ганта в Excel

Как создать диаграмму Ганта в Excel

Как Сделать Настольный ЭЛЕКТРОЭРОЗИОННЫЙ Станок?

Как Сделать Настольный ЭЛЕКТРОЭРОЗИОННЫЙ Станок?

Фишки Excel, которые я использую КАЖДЫЙ ДЕНЬ! ЭТО нужно каждому

Фишки Excel, которые я использую КАЖДЫЙ ДЕНЬ! ЭТО нужно каждому

How to Make a Simple Gantt Chart in Excel

How to Make a Simple Gantt Chart in Excel

How to Create Gantt Chart in Excel with Pending, In Progress and Completed Status

How to Create Gantt Chart in Excel with Pending, In Progress and Completed Status

Как создать диаграмму Ганта в Excel — самый простой способ!

Как создать диаграмму Ганта в Excel — самый простой способ!

Как создать диаграмму Ганта в Google Таблицах

Как создать диаграмму Ганта в Google Таблицах

© 2025 dtub. Все права защищены.


  • Контакты
  • О нас
  • Политика конфиденциальности


Контакты для правообладателей: [email protected]