ggplot2 package| Understanding grammar of graphics
Автор: Plotly Analytics - Giving Life to Data
Загружено: 2023-12-10
Просмотров: 55
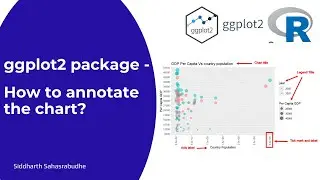
All the graphics generated using ggplot2 package follow common design philosophy - A Grammar of Graphics.
The Grammar tells us that a statistical graphic is a mapping from data to aesthetic
attributes (colour, shape, size) of geometric objects (points, lines, bars). The plot may also contain statistical transformations of the data and is drawn on a specific coordinate system. Facetting can be used to generate the same plot for different subsets of the dataset. It is the combination of these independent components that make up a graphic.
The Rmarkdown file used in the session can be found at:
https://github.com/siddharth-sahasrab...

Доступные форматы для скачивания:
Скачать видео mp4
-
Информация по загрузке: