Скачать
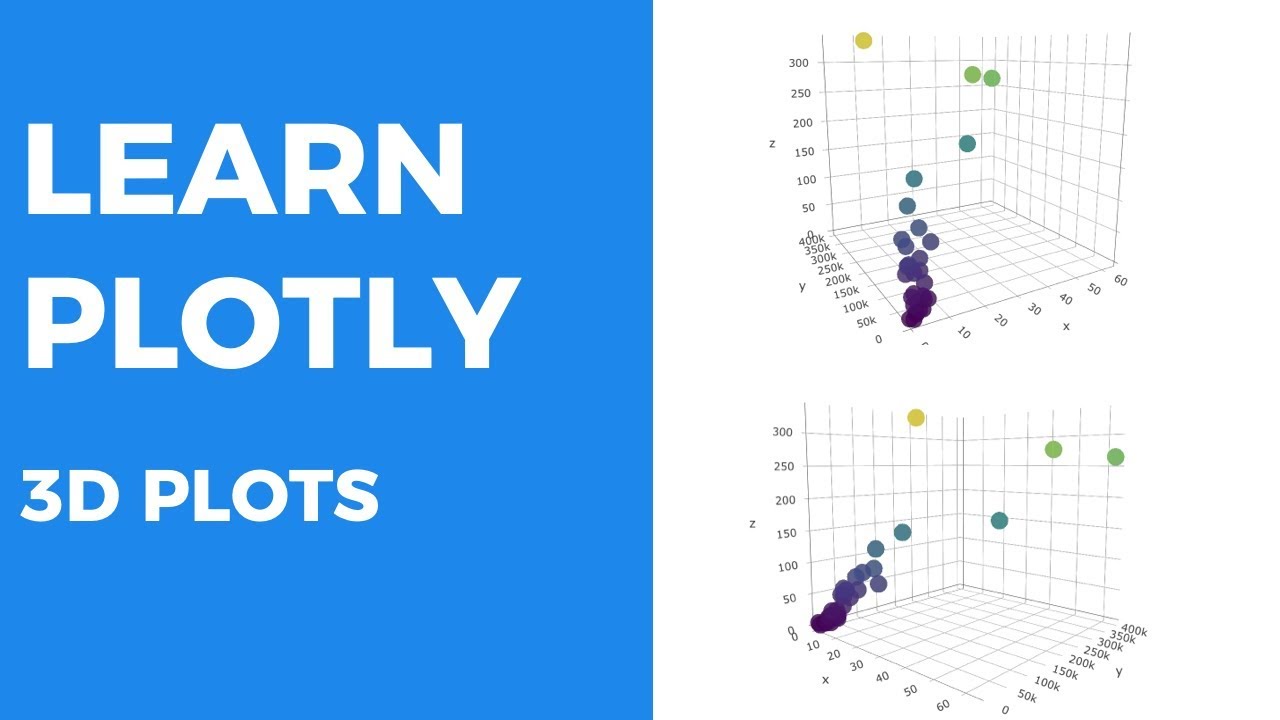
LEARN PLOTLY - CREATING MAPS
Автор: Art of Visualization
Загружено: 2018-11-14
Просмотров: 37093
Описание:
Supplemental Materials - http://www.superdatascience.com/learn...
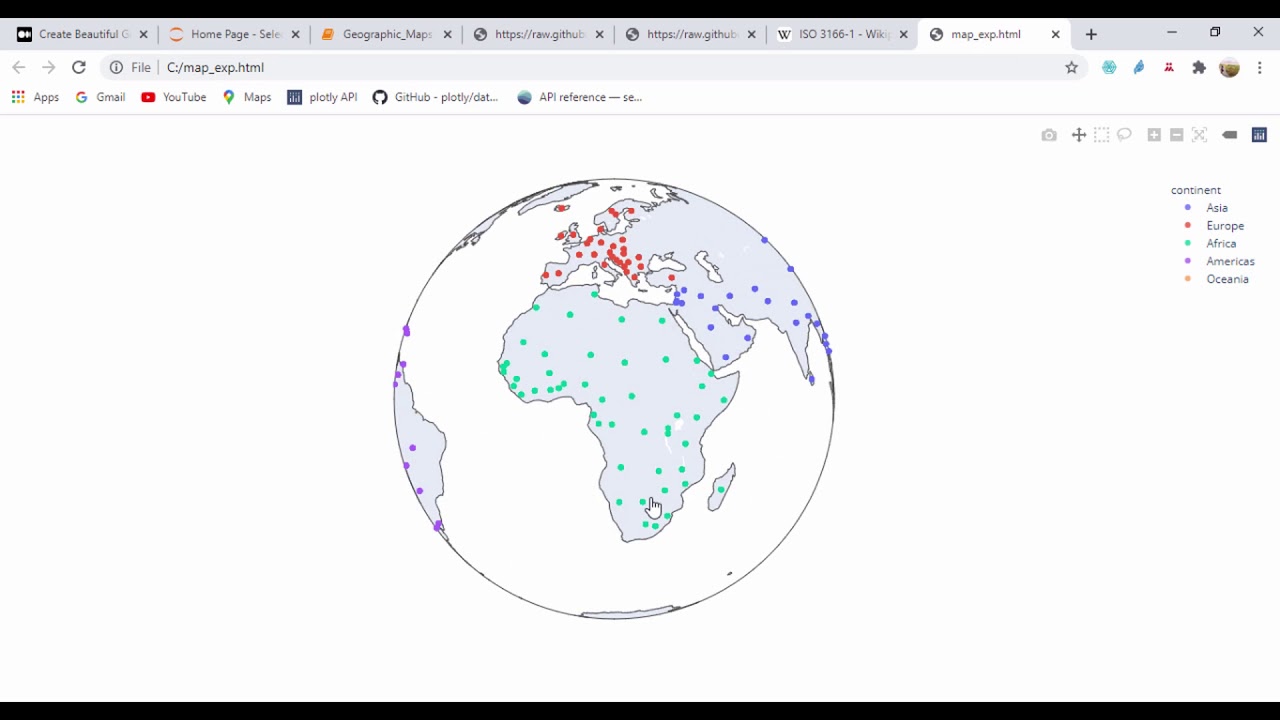
Welcome back to our Working With Plotly series! In this episode, we are going to take a look at
building choropleth maps. Plotly has some incredible functionality related to maps and this is a key
visualization that can help present data in a clear and visually stimulating method. Join us as we work
through building a map to analyze population distribution amongst a specific state as an example. This
is just another powerful Plotly tool to have so that you can continue advancing your Data science or
Machine Learning career!
Доступные форматы для скачивания:
Скачать видео mp4
-
Информация по загрузке: