Data Visualization with Chart.js
Автор: Coding Journey
Загружено: 2020-02-14
Просмотров: 22038
Learn how to Visualize Data using Chart.js, which is a very popular open-source data visualization JavaScript library!
Chart.js, is simple to use yet flexible, lightweight, reliable, free and it allows us to create clean, elegant and responsive charts using the HTML5 Canvas element. Documentation is excellent as well! So, overall, I think that Chart.js can be a great charting choice!
In this video, we are using Chart.js in order to graphically present poll results. We also demonstrate, how to update the chart as soon as data changes.
Enjoy 🙂
Don’t forget to share, like, subscribe and I would love to hear your thoughts in the comments section below!
Code for this Project: https://codepen.io/Coding_Journey/pen...
Support the Channel 💙☕🙏
PayPal: https://paypal.me/CodingJourney
Suggested Videos:
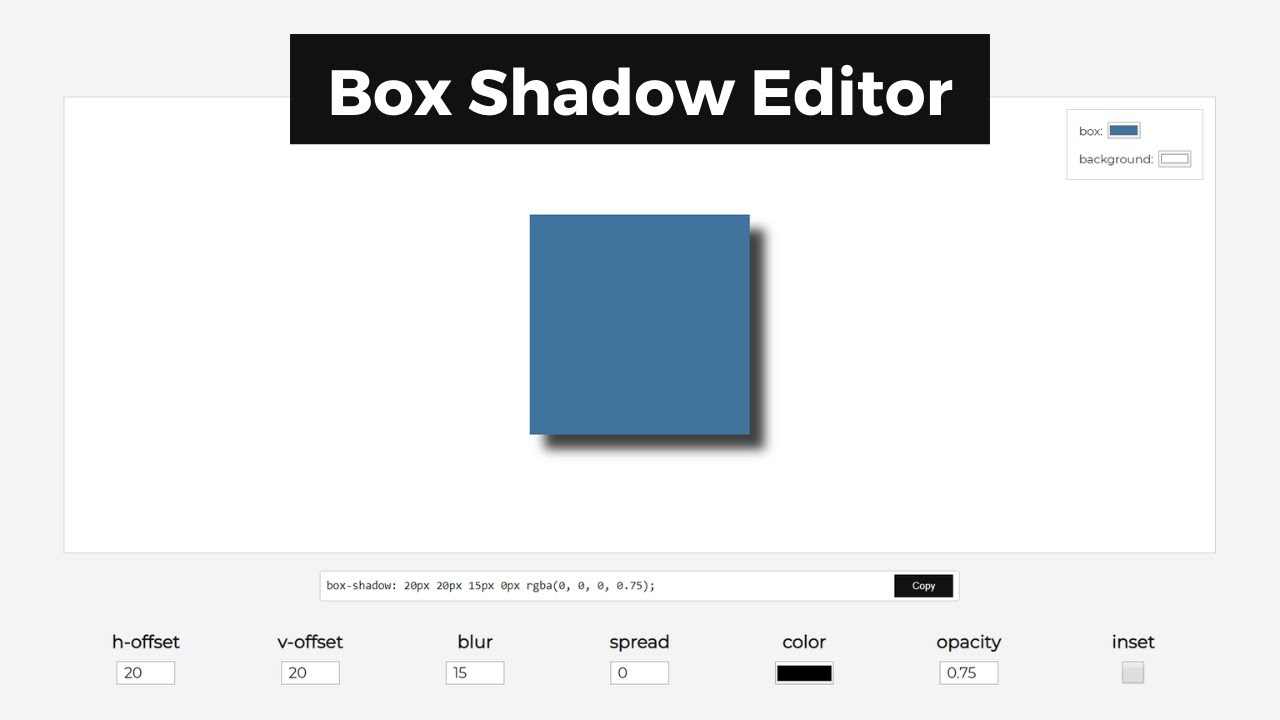
CSS box-shadow Editor: • CSS box-shadow Editor
JavaScript Loops: • JavaScript Loops
Modal with HTML, CSS and JavaScript: • Modal with HTML, CSS and JavaScript
Accordion (HTML, CSS and JavaScript): • Accordion (HTML, CSS and JavaScript)
Currency Converter with HTML, CSS and JavaScript: • Currency Converter with HTML, CSS and Java...
Voice Search with JavaScript (Web Speech API): • Voice Search with JavaScript (Web Speech API)
HTML Drag and Drop API: • HTML Drag and Drop API
Codepen: https://codepen.io/Coding_Journey/
Twitter: / codingjrney
Email: codingjourney123@gmail.com
Subscribe 💖
/ @codingjourney
Доступные форматы для скачивания:
Скачать видео mp4
-
Информация по загрузке:


![D3 JS - Build Data Driven Visualizations with Javascript [svg animation, data engineering]](https://imager.clipsaver.ru/nzshmMlOuwI/max.jpg)


![[#1] Знакомство с Chart.js | Визуализация данных на JavaScript](https://imager.clipsaver.ru/KXSc30qf1TA/max.jpg)