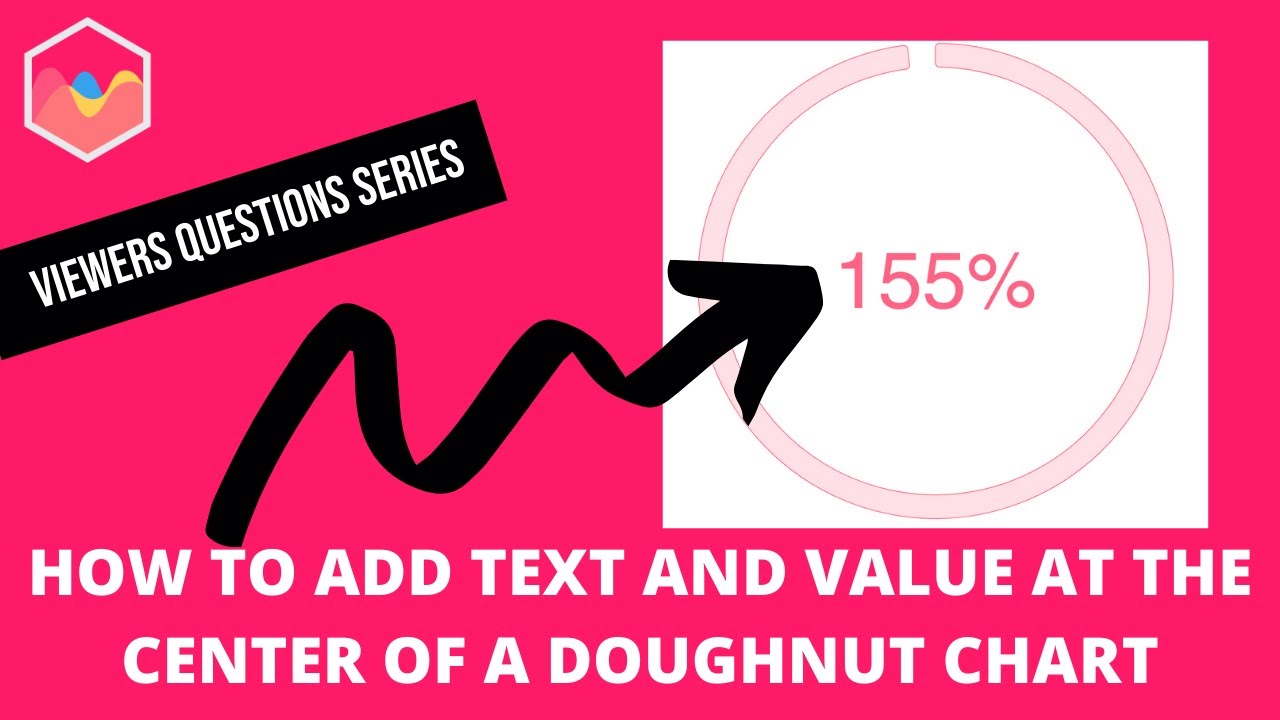
How to Add Text and Value at the Center of a Doughnut Chart in Chart JS?
Автор: Chart JS
Загружено: 2021-07-13
Просмотров: 20987
How to Add Text and Value at the Center of a Doughnut Chart in Chart JS?
Adding text and value at the center of a doughnut chart in Chart JS is desired by many. The center of a doughnut chart has white space and showing the value in there is a perfect fit. However, the solution is usually a so called "hack" using css with position absolute. To make it truly in canvas build in requires a solid foundation of understanding.
This video shows you how to do display text in center of doughnut and ensures that the font will stay centered consistently even if the font size is readjusted. This video is an advanced topic creating a plugin with many moving parts connected together.
This is part of the Chartjs Viewers Question series. Where we answer viewer qeustions. Ths question was asked by one of our viewers. A special thank you to Ban Nguyen. Ban Nguyen asked this question on one of my other videos about Chart JS: • 8 How to create a Plugin in Chart JS | Cha...
Chart JS 3.4.1 Launched! All videos are all made with the latest Chart JS version which is currently Chart JS 3.4.1.
Got a question or special request about a specific item? Comment below and tell me your question. I will make sure to follow up on you!
Perhaps you want to learn even more about Javascript? Or even how to create charts with chart.js in Javascript?
Interested to learn about how to create charts? Check out below!
⭐ Chart JS Udemy Course ⭐:
Enjoy this video and want to dive deeper in a real useful Chart JS Training? Check out my Chart JS course on Udemy, click this link: https://www.udemy.com/course/chart-js...
Chart JS tutorials for Beginners:
🎓 Beginners Serie: • ChartJS intro creating a chart 2018 | Char...
Chart JS tutorials for Intermediate:
👁️ Most Watched Chart JS Video: • Update dynamic chart js | Chart.js Course
⭐ Personal Favorite Chart JS Video: • How to make an interactive bar chart in Ch...
Chart JS Dashboard Series:
👍 Most Liked Video Series:
Watch Part 1: • How to make a chart dynamic with input fie...
Watch Part 2: • How to make a chart dynamic with input wit...
Watch Part 3: • How to add a dynamic colorpicker input to ...
Why did I created these Chart JS video tutorials?
Have you ever used Excel where charts appear almost magically with a click on a button. You notice if you look at a chart or graph you can absorb information within seconds which would take you minutes if it is a table with data.
"A picture is worth a thousand words"
We all know that pictures and colors spark the mind. However, if you try to draw or code a 📊 bar chart or a 📈 line chart, or any type of chart in a Javascript library it is a big challenge. The documentation makes it hard and the it is very hard to work with a canvas tag.
Which was both logical and creative at the same time. And this is why I love charts as well. A chart is the closes to translating logic into visuals. Making the chart interactive is the best way to communicate your message to others.
If we know about this why is coding charts so complicated?
Because computer programming language is based on 100% logic. This is why when you look at Chart.JS, D3.JS, Chartist and other chart libraries in JS you will need to basically explain in logic to a computer what to make visual.
How and where can I help?
My goal and focus is on creating easy to understand Chart.JS videos so you can start using Chart JS in all your website endeavors making Chart.JS a topnotch and leading JS library for the years to come. Just like any programming library once more people use Chart JS it will attract more people to contribute and grow. The videos on Youtube and my complete course on Udemy are here to give a helping hand.
Seeing Chart.JS evolve from Chart.JS 1.0 to Chart.JS 3.0 and with their currently new expansion to Chart.JS 3.0 we can expect more new exciting charts in the near future.
About Chart.JS 3 | Chart JS 3
Chart JS is one of the most use Javascript libraries for the drawing charts. It is designed to create charts in the canvas tag which is great but at the same time slightly challenging for most people. However, knowing how to draw a chart will give you a big edge and most dashboards are consistently adding charts along data tables. Chart JS makes your data more alive and visually more appealing.
What type of charts can you make with Chart.JS?
With chart js you can make line chart, bar chart, pie chart, doughnut chart, scatter chart, polar area chart, radar chart, gauge chart and area chart. And with some clever tricks and visual adjustment more can be done.
#chartjs
Доступные форматы для скачивания:
Скачать видео mp4
-
Информация по загрузке: