Create an Interactive Crime Map with Python and Folium | Step-by-Step Tutorial
Автор: Data Geek is my name
Загружено: 2025-04-04
Просмотров: 747
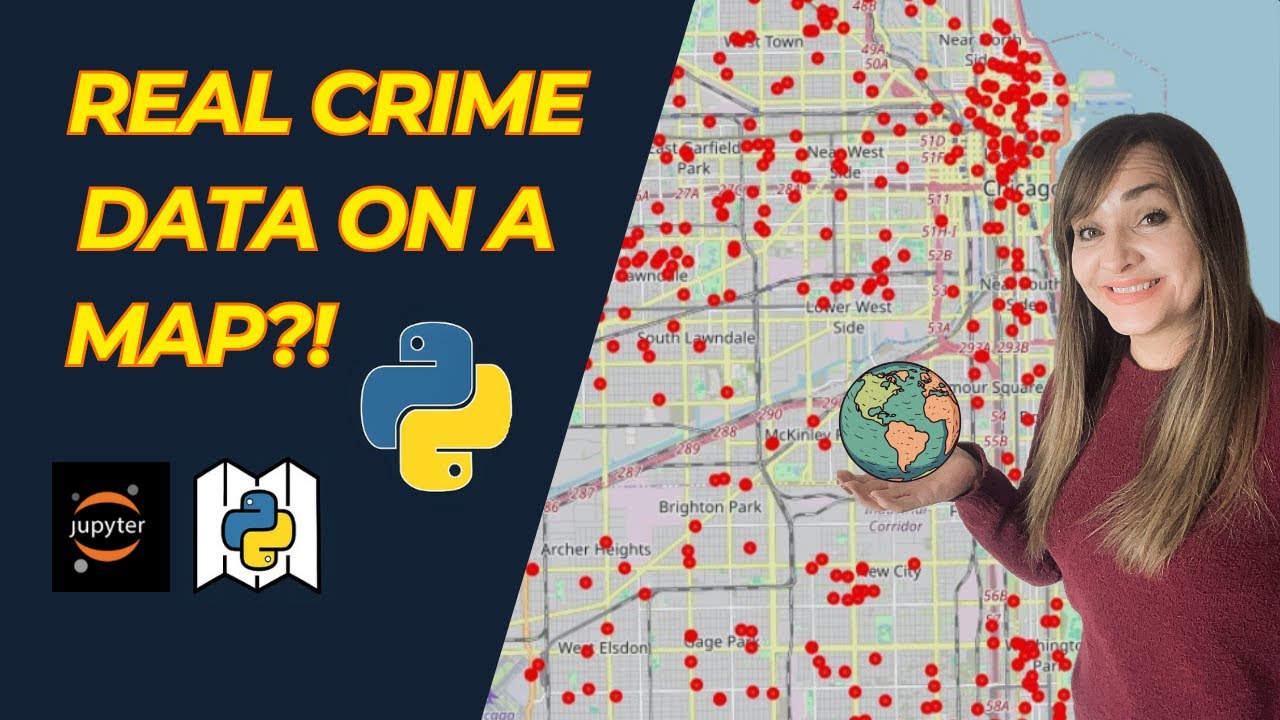
In this tutorial, learn how to visualize crime data by creating an interactive map using Python and Folium. We'll fetch real-time crime data from the Chicago Crime API, process it with Pandas, and plot it on a dynamic map. Perfect for data enthusiasts and aspiring data scientists looking to enhance their geospatial analysis skills.
Fetching real-time data from the Chicago Crime API
• Processing data with Pandas
• Creating interactive maps using Folium
• Visualizing geospatial data effectively
Data Set
• Dataset Used: Crime Chicago data: https://data.cityofchicago.org/resour...
Download Anaconda
• Anaconda Installation Video to use Jupyter Notebook: • How to Download Anaconda for Jupyter Noteb...
____________________________________________
🔔 Don’t forget to LIKE & SUBSCRIBE for more Python & Data Analysis tutorials!
💬 Have a question ? Drop it in the comments!
💎 Want to Buy Me A Coffee : https://buymeacoffee.com/datageekismy...
____________________________________________
Continue your learning with Python
https://learnpython.com/?ref=mgzmzjn
*Get free resources to continue learning:
https://www.excelcampus.com/161.php
===== *Great Books For Mastering Data Science and Data Cleaning =====
Python For Data Analysis: https://amzn.to/4dQUOaF
Python Data Science Handbook: https://amzn.to/3BV6hsk
Hands-On Machine Learning with Scikit-Learn & TensorFlow: https://amzn.to/4h8IxRS
Python Machine Learning by Sebastian Raschka: https://amzn.to/401eIMU
Modern Python Cookbook: updated: https://amzn.to/3BV6sE0
______________________________________________
⏳ Timestamps ⏳
00:00 Introduction
00:32 Create a new notebook in Jupyter notebook
00:42 How to title the new workbook in Jupyter Notebook
00:56 How to change your Jupyter Notebook Theme to Dark mode
01:21 Install Folium into Jupyter Notebook
02:18 Step 1: Import the Python libraries (Folium, Pandas, Requests)
03:46 Step 2: Connect to API to get the crime data
05:37 Step 3: Convert the data into a Table (DataFrame)
08:10 Check summary of the DataFrame (Data types, number of rows, etc.)
09:35 Step 4: Clean and only keep what we need from the data
13:00 Step 5: Create the base map centered on Chicago
14:47 Step 6: Add crime points to the map
15:49 Step 7: Show the map
#dataanlysis #pythonforbeginners #jupyternotebook #python #datascience #pythontutorial #pythonbeginner
______________________________________________
*Disclaimer*: This content is for educational purposes only. Affiliate links may be included, and I may earn a small commission at no extra cost to you. Thank you for supporting the channel!
Доступные форматы для скачивания:
Скачать видео mp4
-
Информация по загрузке: