Candlestick Wicks Explained: What Long Wicks Really Mean in Trading
Автор: PipBuddy
Загружено: 2025-12-16
Просмотров: 127
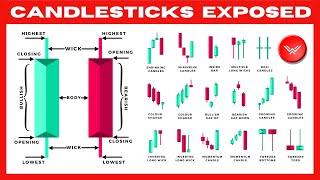
Candlestick wicks are one of the most revealing signals on a price chart. They show rejection, exhaustion, strength, and indecision in real time. Today we break down exactly what long upper and lower wicks mean, why they form, and how to use them to make more informed trading decisions.
What you’ll learn:
• What wicks represent and how they form
• Why upper wicks signal rejection and fading momentum
• Why lower wicks show support or buyer strength
• What long-wick dojis say about indecision
• Why wick interpretation depends on trend and levels
• How to use wicks for entries, exits, and stop placement
• How to avoid common wick mistakes across timeframes
Watch next:
• Support and Resistance Explained (Price’s Invisible Walls)
• Chart Types Explained (Line, Bar, Candlestick)
• The 3 Lenses of Market Analysis
Join our Telegram community for simple, no-hype trading guidance:
https://t.me/pipbuddy
About PipBuddy:
We help everyday traders understand Forex in plain English. No hype, no jargon, and no get-rich-quick promises. Just clear explanations and practical steps you can use right away.
For education only.
0:00 Why Candlestick Wicks Matter
0:50 What Wicks Represent on the Chart
2:13 Long Upper Wicks (Seller Rejection)
2:50 Long Lower Wicks (Buyer Strength)
3:20 Small Bodies, Long Wicks (Indecision)
4:00 Context: Trend, Levels, and Volume
4:32 Using Wicks for Entries and Exits
5:08 Common Wick Mistakes Beginners Make
6:17 Final Thoughts and What’s Next
#forextrading
#forexforbeginners
#pipbuddy

Доступные форматы для скачивания:
Скачать видео mp4
-
Информация по загрузке: