Скачать
How to interpret atmospheric soundings
Автор: sharemyjoys
Загружено: 2020-11-02
Просмотров: 17683
Описание:
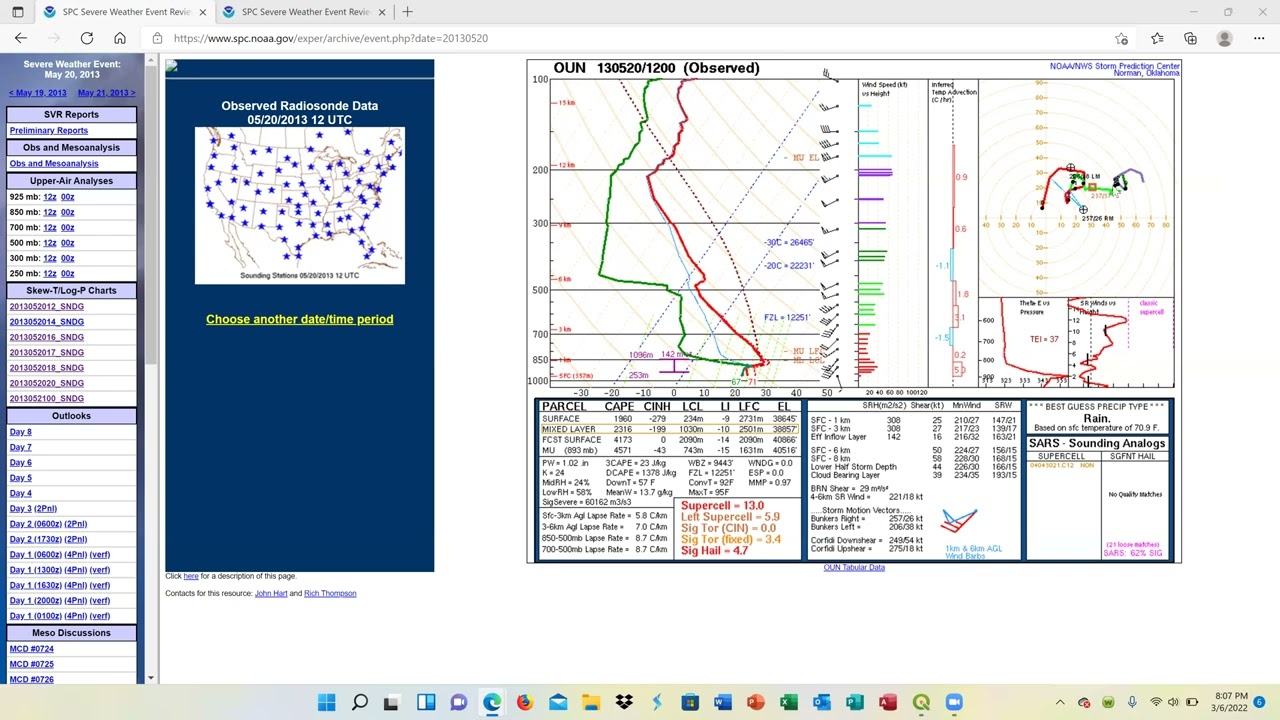
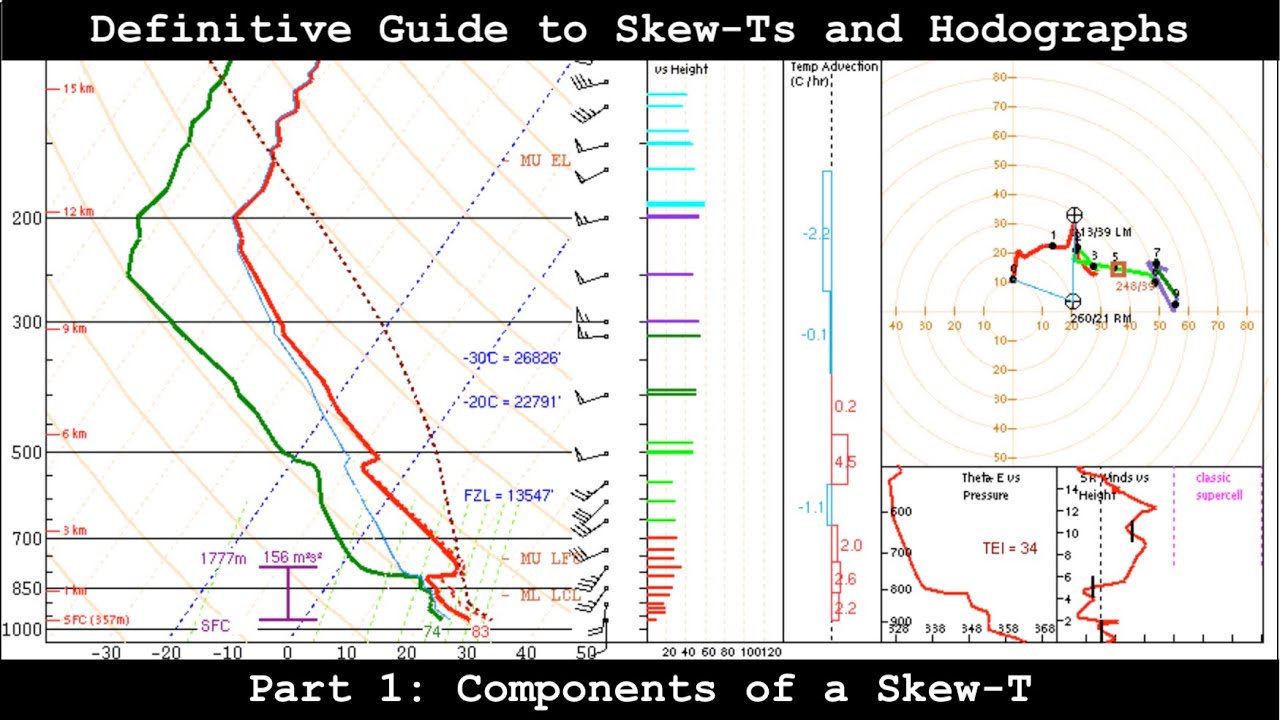
Also known as the temperature trace, skewT chart, or Aerological diagram, this is a comprehensive snapshot of the atmosphere which a forecaster will look at all day long when analysing the airmass. They are very useful for soaring pilots, and show you winds, potential for cloud, depth of cloud, and height of thermals. This is a short introduction, you could really go in depth and talk for hours about different ways to use this chart.
Most of the footage taken today (2 November 2020) in Brisbane, with some additional time lapse from earlier in the year.

Доступные форматы для скачивания:
Скачать видео mp4
-
Информация по загрузке: