Скачать
AI Engineering Day 9 🔥 | Matplotlib for Data Visualization | AI & ML Graphs Explained
Автор: CodeWithPrashant
Загружено: 2026-01-17
Просмотров: 139
Описание:
Welcome to AI Engineering Day 9 🚀
In this video, you’ll learn Matplotlib from scratch and understand data visualization techniques used in AI & Machine Learning.
Topics covered:
What is Data Visualization
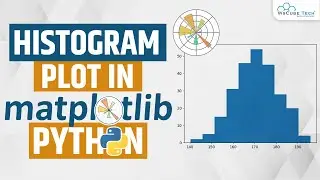
Line, Bar, Scatter & Histogram plots
Model Accuracy & Loss Graphs
How AI engineers analyze data visually
This session is extremely important for:
✔ AI & ML beginners
✔ Data Science aspirants
✔ Python learners
Part of our Complete AI Engineering Roadmap 2026.
#AIEngineering #Matplotlib #DataVisualization #AIEngineer #PythonForAI #MachineLearning #AI2026 #DataScience #LearnAI

Доступные форматы для скачивания:
Скачать видео mp4
-
Информация по загрузке: