Скачать
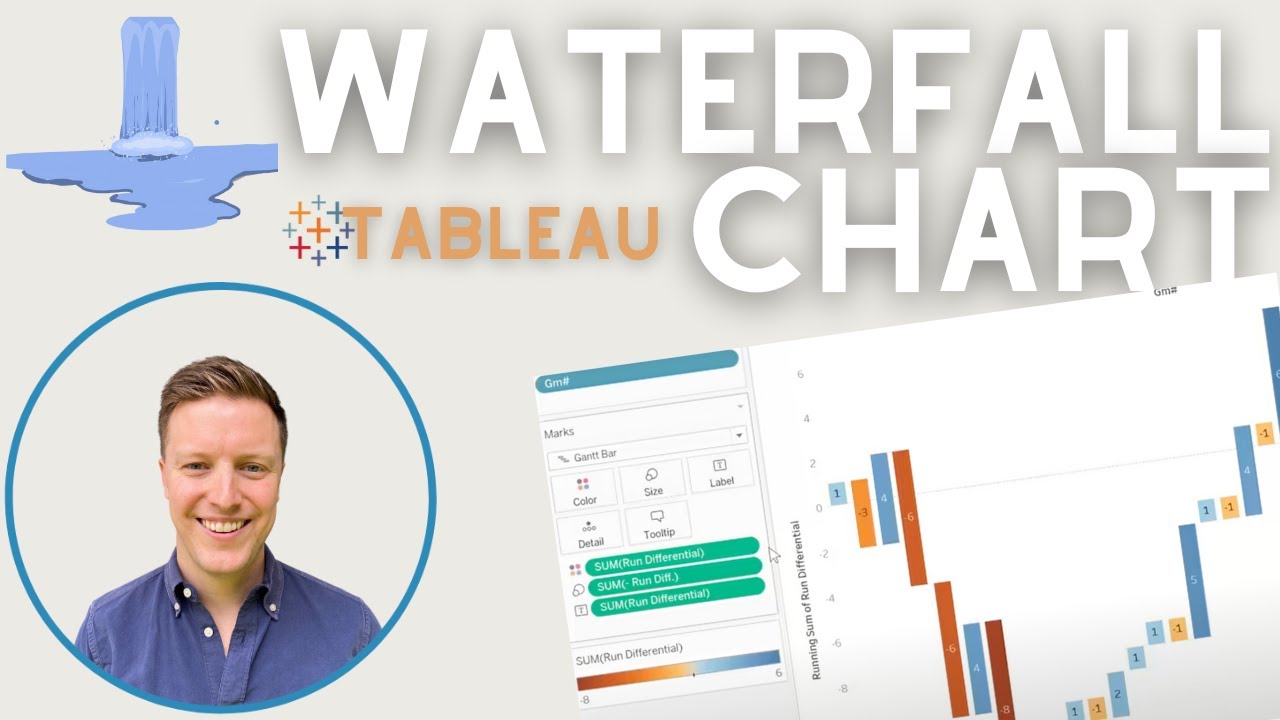
How to Build a Waterfall Chart in Tableau
Автор: OneNumber - Tableau Experts
Загружено: 2021-09-09
Просмотров: 1294
Описание:
Thanks for checking out this video! To learn more, check out our upcoming classes, webinars and office hours here: https://www.eventbrite.com/o/onenumbe...
------
Waterfall charts are a powerful visual you can create in Tableau to demonstrate the running, cumulative effect of positive and negative values over time. They are fun way to spice up your dashboards, but it can be difficult to remember each of the exact steps you need to follow.
They are great for:
-Displaying profitability trends
-Displaying headcount increases and decreases over time
-Displaying point differential by game
Доступные форматы для скачивания:
Скачать видео mp4
-
Информация по загрузке:


