3D Infographic Column Chart in Excel | Infographic Design | Faysal Easy Excel
Автор: Faysal Easy Excel
Загружено: 2023-12-22
Просмотров: 1786
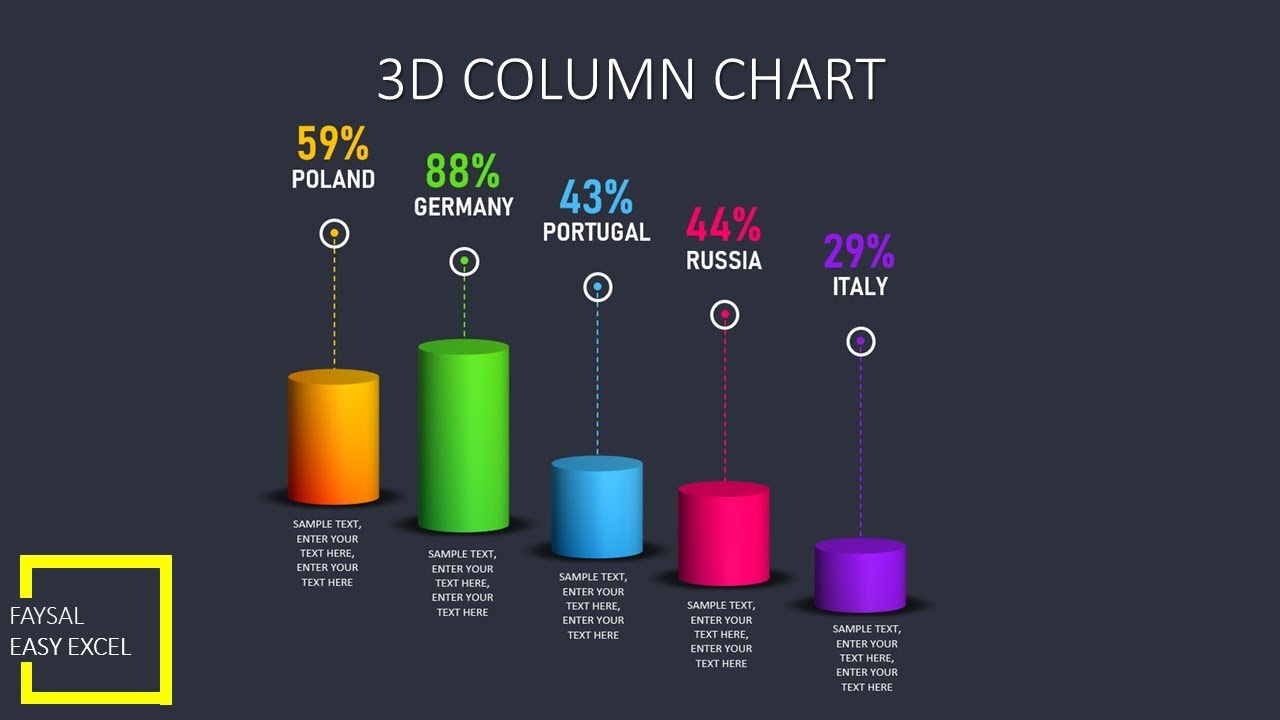
In this video you will learn how to do infographic design with color grading, converting a simple 3D column chart into a beautiful chart to present. If you like my video, please SUBSCRIBE for more upcoming videos.
👆 Please SUBSCRIBE:
https://www.youtube.com/faysaleasyexc...
💾 Free Download Link:
https://docs.google.com/spreadsheets/...
✅ Join us:
YouTube: https://www.youtube.com/faysaleasyexc...
Facebook: / faysaleasyexcel
LinkedIN: / faysaleasyexcel
Blog: https://afaysal.blogspot.com
🎥 Watch our other videos:
1. Emojis in Excel: • How to insert Emojis in Excel formula with...
2. Excel Match function: • Excel Match function and how to use Match ...
3. Excel MID function: • Excel MID Function | Extract the Time from...
#excelcharts #3dstackedbarchart #stackedcolumnchart #2dchart #exceltips #exceltricks #msexcel #faysaleasyexcel #excelformula #excel2016 #learnexcel #excelforbeginners #microsoftexcel #exceltraining #msexcel #excelformula
Доступные форматы для скачивания:
Скачать видео mp4
-
Информация по загрузке:


