Скачать
Excel - How to plot a line graph with standard deviation
Автор: Laura Smith
Загружено: 2021-03-18
Просмотров: 224852
Описание:
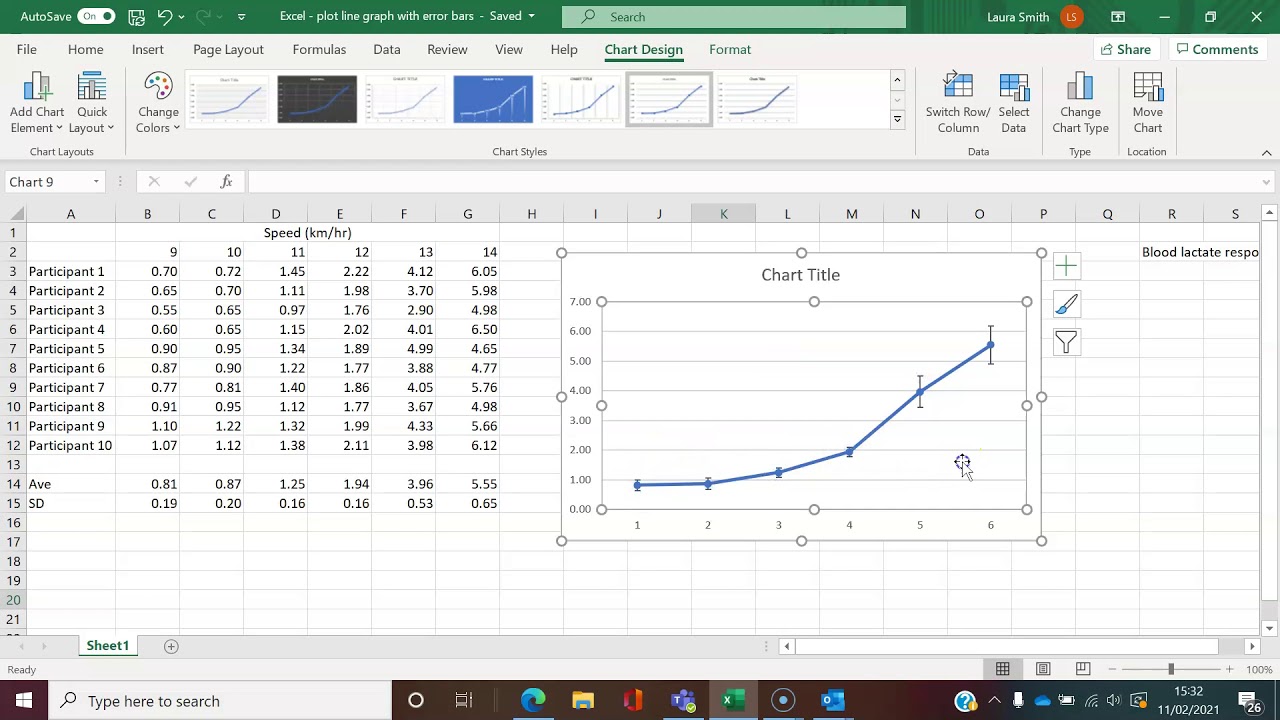
General Lab skill (Excel). This video will demonstrate how to plot a line graph with standard deviation presented as error bars. In the video the version of Excel used is within Microsoft 365.
Доступные форматы для скачивания:
Скачать видео mp4
-
Информация по загрузке: