Скачать
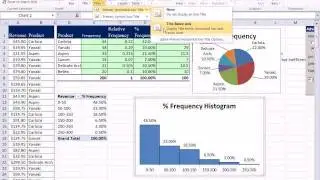
Make Pie Graphs and Frequency Distributions in Excel: Categorical Data
Автор: BurkeyAcademy
Загружено: 2016-08-31
Просмотров: 73170
Описание:
Here we make frequency distributions two ways: First using the COUNTIF function, and then using a Pivot Table. Link to the Excel Data File: https://docs.google.com/spreadsheets/...
My Playlist of Short Excel Videos: • Short Excel Videos: Burkey Bytes
Much more Stats, Economics, Econometrics, and more at my (always free) Website!
My Website: http://www.burkeyacademy.com/
Support me on Patreon! / burkeyacademy
Talk to me on my SubReddit: / burkeyacademy
Buy me a cup of coffee on PayPal? http://paypal.me/BurkeyAcademy

Доступные форматы для скачивания:
Скачать видео mp4
-
Информация по загрузке: