Скачать
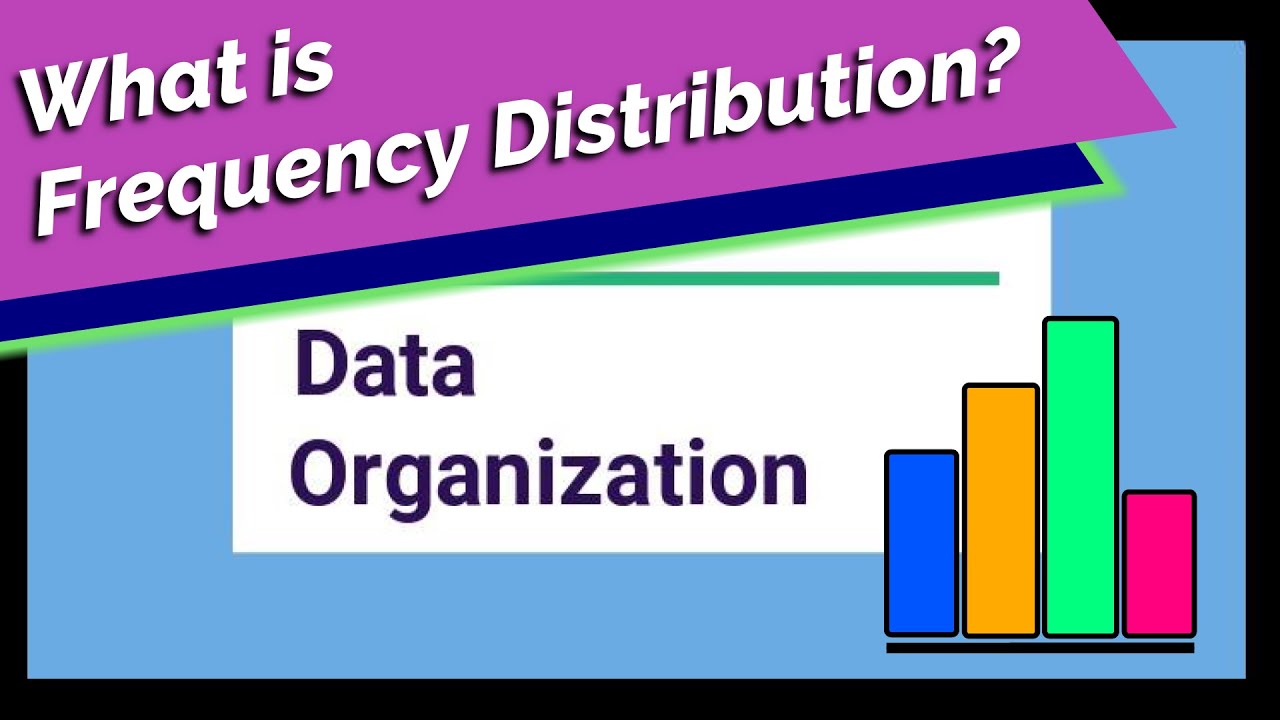
How to organize data
Автор: USA Math & Stat
Загружено: 2020-10-01
Просмотров: 15369
Описание:
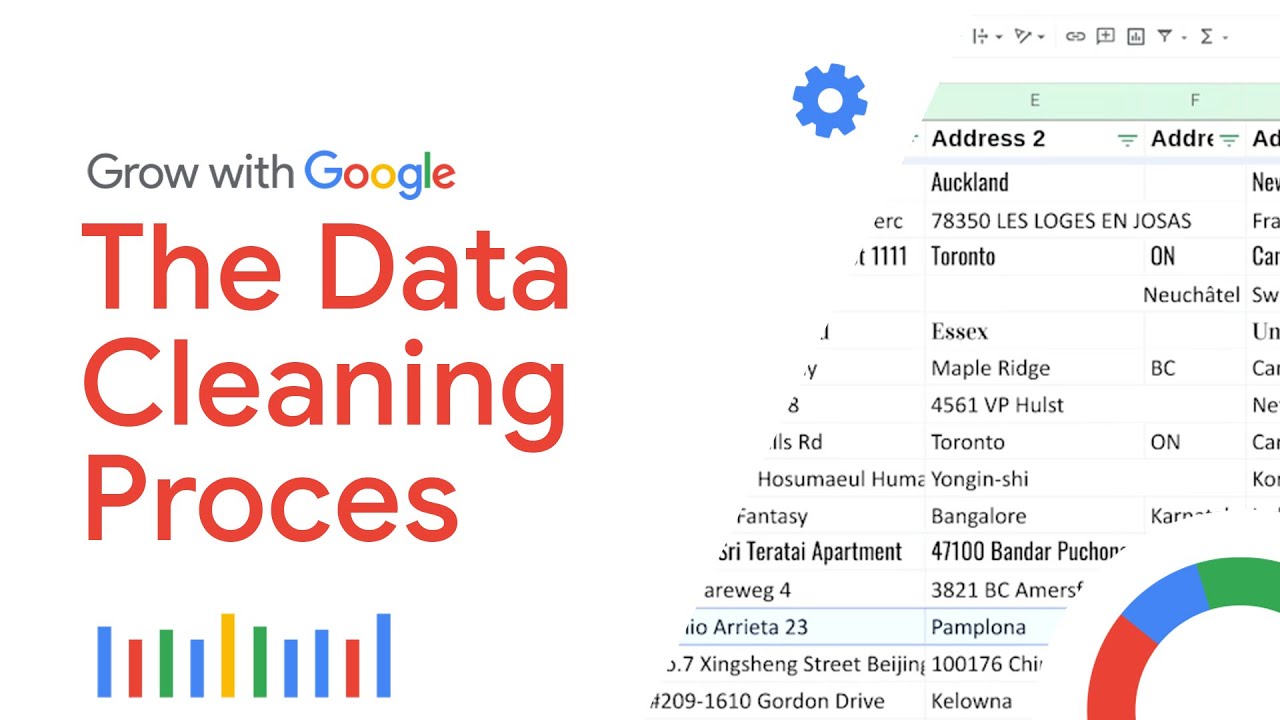
Hello learners! In this video you will learn about tabular and graphical methods of descriptive statistics such as frequency distributions, stem and leaf plot, frequency histograms and ogive. These methods are helpful in summarizing data so that the data can be easily understood and summarized.
Data visualization - is a term used to describe the use of graphical displays to summarize and show information about a data set.
Data Set Reference:
https://s3.amazonaws.com/s3.edu20.org...
Доступные форматы для скачивания:
Скачать видео mp4
-
Информация по загрузке:


![Неожиданная правда о 4 миллиардах лет эволюции [Veritasium]](https://imager.clipsaver.ru/Unxh6MnVIWc/max.jpg)