Data Analyst Projects | Visualizing Data with Tableau | Part 2
Автор: Angelina Frimpong
Загружено: 2022-02-15
Просмотров: 3540
Build a Data Analyst portfolio with me!
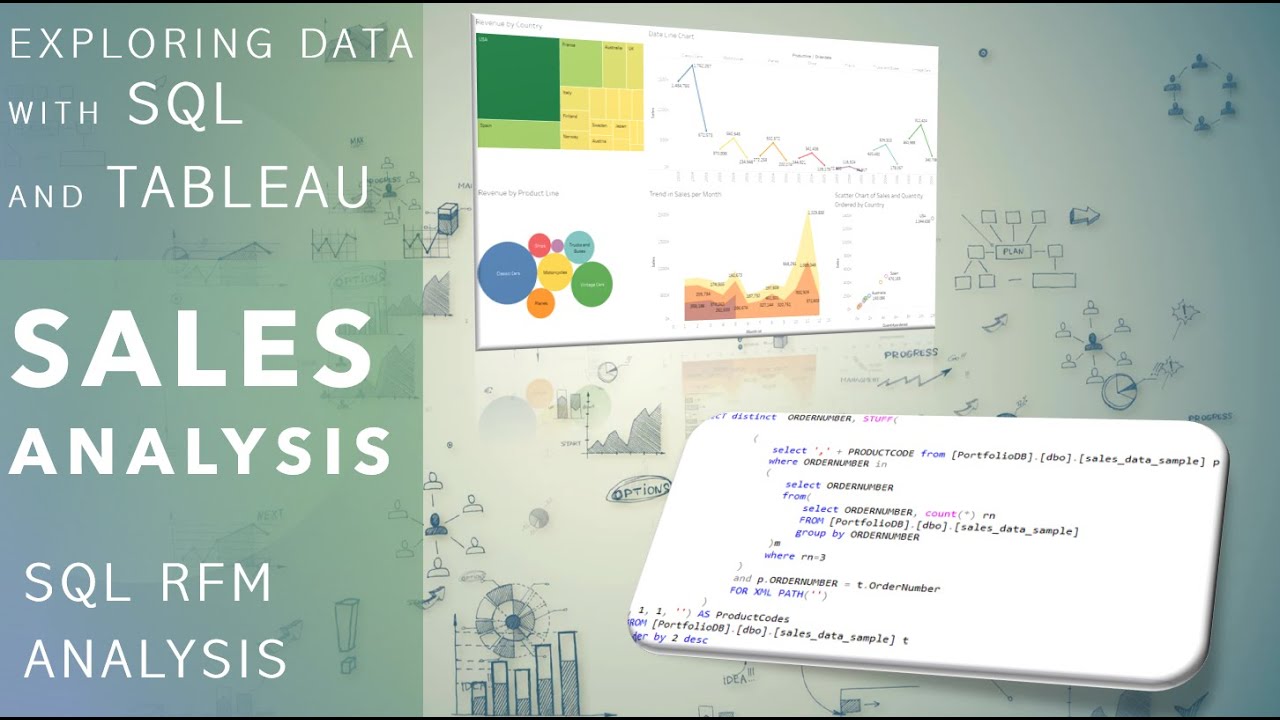
In this video, we go through how to build visualizations with Tableau and publish visualizations to Tableau Public. We will make multiple visualizations and then combine the different visualizations to create a dashboard.
Stay Tuned for Part 3 | Exploring Data with Python
-LINKS-
Tableau Public
https://public.tableau.com/en-us/s/do...
My Tableau Public Dashboard
https://public.tableau.com/views/PPPS...
Access the SQL queries used in the demo from my GitHub repository
View for visualizing Data:
https://github.com/AllThingsDataWithA...
HAPPY WITH THE CONTENT?
SUBSCRIBE NOW! CLICK HERE - / @angelinafrimpong
OR HERE - https://bit.ly/angelinafrimpong
Timestamps:
00:00 Intro
00:00:40 Getting Tableau Public
00:03:09 Preparing Data for Tableau
00:07:47 Connecting Data to Tableau
00:09:02 Visualization 1 - Summary
00:16:45 Visualization 2 - Bar Chart
00:20:43 Visualization 3 - Map
00:27:40 Visualization 4 - Top N Parameter and Table
00:42:22 Building Dashboards
00:49:55 Publishing Dashboard to Tableau Public
00:52:27 Outro
#DataAnalyst #SQL #TableauDataAnalytics

Доступные форматы для скачивания:
Скачать видео mp4
-
Информация по загрузке: